Concentration of risk
Liabilities within any given portfolio are rarely equal, and they usually differ widely in size. Typically, a large proportion of liabilities is concentrated in a relatively small number of lives, so this should always be checked.
One measure of inequality in income distribution is the Gini Index, which is widely used in the social sciences. It ranges from 0% (perfect equality) to 100% (one person has all the income). The CIA World Fact Book gave the UK as a whole a value of 36.8% in 2005, and the UK is one of the more unequal countries among developed nations. Equivalent figures for portfolios of insurance-company liabilities and pension schemes routinely exceed this value, i.e. such portfolios are even more unequal as society as a whole.
An alternative approach is to show the proportion of liabilities for each decile of lives. This is shown below for two portfolios, one of life-office annuities and the other of defined-benefit pensions:
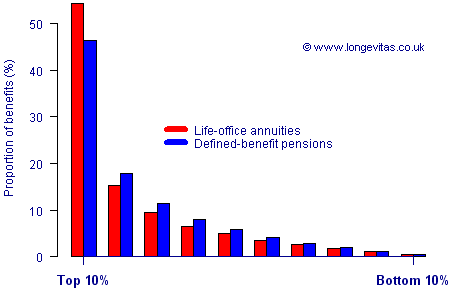
As we can see, pension benefits are tremendously concentrated, with the top 10% of lives receiving around half of all benefits. This concentration of liabilities carries an extra risk, namely that the lives with the largest proportion of liabilities have a markedly different life expectancy than the ones with the smallest proportion.
When assessing demographic risk, it is critical to look at the socio-economic profile of the people who form the bulk of the liabilities.
Concentration statistics in Longevitas
Longevitas users can get concentration statistics and charts for a portfolio by clicking ![]() within any model report.
within any model report.
Add new comment