Picking a winner
So what will the winner of the battle of the UK General Election be able to tell us about projection modelling? I'm not talking about the parties who will gain a share of power after May 7th, but which of the polling organisations will most closely forecast the results.
The record of UK pollsters hit a memorable low in the 1992 General Election. In the week prior to the vote they were finding an average Labour lead of 2%, thus spectacularly failing to spot the actual outcome: a Tory win by almost 8%. With the benefit of hindsight, it is easy to see that their models were systematically wrong. The Market Research Society undertook a review of the debacle which identified both methodological and behavioural reasons. These included a so-called “Shy Tory” factor, where Conservative-supporting respondents were less likely to be truthful with pollsters about how they planned to vote.
What then should we make of the current sets of polls? A superficial reading suggests two things. Firstly that Labour and the Conservatives are neck-and-neck in the low 30%s. Secondly that the lead seems to swing from one to the other. Does this imply a dead heat, masked by sampling error? A look in more detail suggests other possibilities. Of the nine organisations polling regularly, three tend to find a Labour lead (Mori, Populus and Panelbase), four a Conservative one (Opinium, ICM, ComRes and Ashcroft), with the other two (YouGov and TNS) showing a switching lead.
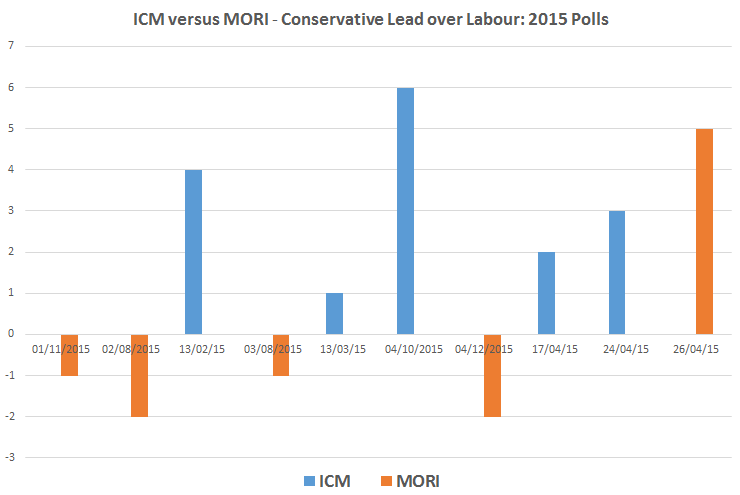
Each company has its own approach to their questioning and calculations, with, for example, different ways of prompting answers, weightings and adjustments for likelihood to vote. In spite of the secrecy about methodologies, psephologists have identified an area of consistency: companies who use internet polling are generally finding a Labour lead, those using the telephone a Conservative one. This suggests the possibility of a stronger systematic pattern which some companies are missing.
What is the relevance for insurers in their choice of models for mortality projections? There are two key lessons. Firstly, it's clearly impossible for us to judge between the pollsters models because they are based on factors we do not know and thus cannot question. In mortality projection work we can address this by only using models which have been published in peer-reviewed academic literature. This peer-process screens out blatantly unsuitable approaches, and open publication in academic journals then allows further public scrutiny. The converse – use of a model which has not been peer-reviewed and openly published – increases risk, because problems are less likely to have been identified.
The second lesson is in the number of models that should be considered. Relying on a single model exposes you to the potential failings of that model. If instead you use multiple models to explore this model risk, then you are much less likely to be caught out by those failings.
Add new comment