Back(test) to the future
Stochastic projections of future mortality are increasingly used not just to set future best-estimates, but also to inform on stress tests such as for ICAs in the UK. By the time the Solvency II regime comes into force, I expect most major insurers across the EU will be using stochastic models for mortality projections (if they are not already doing so).
Nevertheless, there are still some people who harbour doubts about stochastic models. One way to address such skepticism is to look at how such models would have performed in predicting the recent past. This is known as a back-test. The idea is that we take a long data series on mortality (here the ONS data for males in England & Wales from 1961-2007) and carry out a projection using only the data up to 1992 (say). The resulting projection can then be compared with the actual data from 1993 onwards to assess the accuracy of the model.
In this exercise we will use the stochastic projection model from Lee & Carter (1992). Although this model now has a number of well-documented flaws, it would have been the state-of-the-art stochastic projection model around 1992. By way of comparison we will also use the CMIR17 actuarial projections from 1993 onward to illustrate what actuaries would likely have done around that time. The CMIR17 projections actually date from 1999, but such deterministic projections were standard amongst actuaries back then. The results are shown in Figure 1.
Figure 1. Male mortality rates at age 70 in England & Wales to 1992, together with Lee-Carter projections and CMIR17 projections from 1993 onwards (Source: ONS data, CMIR17).
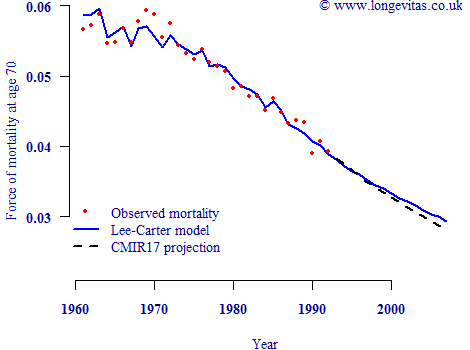
Figure 1 shows that the actuarial projections are slightly more prudent than the central stochastic projection. However, to assess the adequacy of either projection basis we need to add back the actual mortality rates from 1993 onwards:
Figure 2. Male mortality rates at age 70 in England & Wales, together with Lee-Carter projections and CMIR17 projections from 1993 onwards (Source: ONS data, CMIR17).
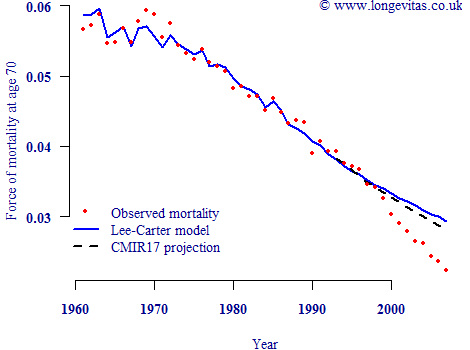
Figure 2 shows that both methods failed badly to anticipate the emerging future mortality trend amongst UK males, known as the cohort effect. A deterministic actuary might therefore be tempted to conclude that stochastic projections have little to offer. This would be foolish, since stochastic methods offer something extra which is critically important: a statement of uncertainty over the central projection. Figure 3 below repeats Figure 2 but with the addition of the 95% confidence intervals for the Lee-Carter projection:
Figure 3. Male mortality rates at age 70 in England & Wales, together with Lee-Carter projections and CMIR17 projections from 1993 onwards (Source: ONS data, CMIR17).
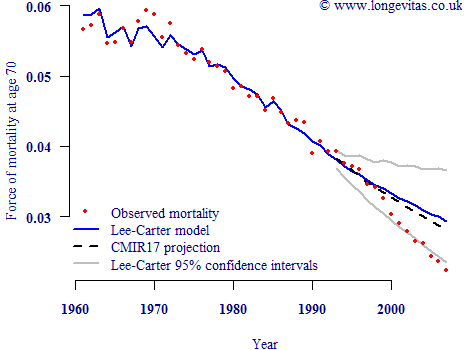
Now we can see the true value of a stochastic projection model, even one with known flaws such as the Lee-Carter model. Had the actuary in 1993 prepared alternative reserves using the lower confidence interval, his client insurer or pension scheme would have been much less surprised by the subsequent emergence of faster mortality improvements. This simple example shows why stochastic projection methods should lie at the centre of any ICA or Solvency II stress test for pensioner longevity.
Add new comment