Cast adrift
One of the most written-about models for stochastic mortality projections is that from Lee & Carter (1992). As Iain described in an earlier post, the genius of the Lee-Carter model lies in reducing a two-dimensional forecasting problem (age and time) to a simpler one-dimensional problem (time only).
A little-appreciated fact is that there are two ways of approaching the time-series projection of future mortality rates. A simple method is to treat the future mortality index as a simple random walk with drift. This makes the strong simplifying assumption that the mortality trend changes at a constant rate (apart from the random noise). Figure 1 shows an example projection for males in England & Wales under the drift model.
Figure 1. Observed and fitted values for male mortality at age 70. Lee-Carter model applied to mortality data for males in England & Wales, projections assuming random walk with constant drift term.
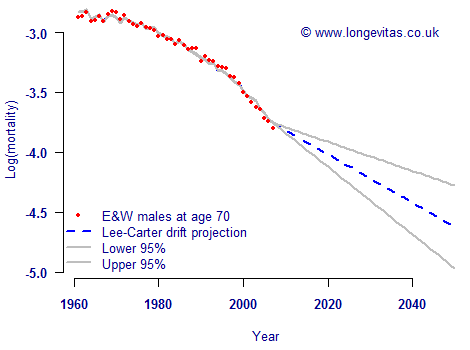
Figure 1 shows an immediate problem with the drift model — the projection is not a natural extrapolation of the recent past. This is because the constant drift rate is essentially estimated from comparing the first and last rates, thus ignoring the pattern of the mortality trend in between.
A better alternative is to use an ARIMA model, of which the drift model is a restricted special case. An ARIMA model is usually specified with three parameters, i.e. ARIMA(p, d, q). A random walk with drift is sometimes described as being an ARIMA(0, 1, 0) model. The ARIMA structure gives greater flexibility in describing a time series, and an example is shown in Figure 2 for the same data. In contrast to the drift model, the full ARIMA model has a more natural-looking projection.
Figure 2. Observed and fitted values for male mortality at age 70. Lee-Carter model applied to mortality data for males in England & Wales, projections assuming ARIMA(3,2,3) process.
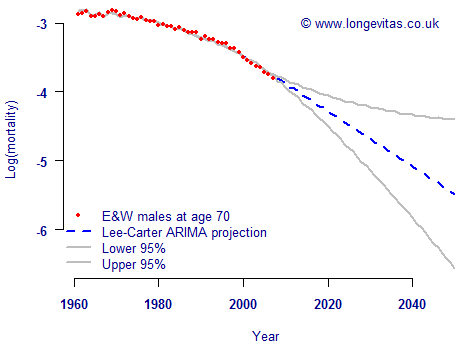
The danger of using a drift model, at least in conjunction with UK population data, is that it projects lower rates of mortality improvement than those seen in the recent past. This would be imprudent for pricing and reserving for annuities and pensions. In Figure 2 the ARIMA model has produced a more realistic-looking projection with faster rates of improvement.
Comments
This is interesting stuff, as ever. In the last paragraph, do you mean:
The danger of using a drift model, at least in conjunction with UK population data, is that it projects higher rates of mortality than those seen in the recent path. ?
What appears from your graphs is an increasing rate of improvement, so that the downward line gets steeper and steeper. As you note, the drift model projects a central improvement rate that draws a straight line across this so there is a discontinuity in the slope going from the past to the projection. Your ARIMA model is better at projecting rates that match the slope of the recent path.
How do you choose which p, d and q to use in the ARIMA(p, d, q) model? Do you have the same problem as ever with a more complicated model leading to a better-fitting model?
You are correct in that the last paragraph isn't quite what I meant to write: I left out the word "improvement", which has now been added!
The choice of p, d and q can be specified directly by the user. However, in this example I used the Projections Toolkit to automatically select the best-fitting combination of p, d and q. The Toolkit does this by automatically considering 18 combinations of p, q and q and picking the one with the lowest AIC. This makes any extra parameters earn their keep by demanding that they make a significant enough improvement in the model fit. Using the AIC (or any other information criterion) helps stop models becoming endlessly complicated.
Add new comment