Forecasting with penalty functions - Part I
There is much to say on the topic of penalty forecasting, so this is the first of three blogs. In this blog we will describe penalty forecasting in one dimension; this will establish the basic ideas. In the second blog we will discuss the case of most interest to actuaries: two-dimensional forecasting. In the final blog we will discuss some of the properties of penalty forecasting in two dimensions.
Forecasting with penalties is very different from forecasting with the more familiar time series methods, so let us begin with a time-series example. The Lee-Carter model assumes that:
\(\log \mu_{i,j} = \alpha_i + \beta_i \kappa_j\qquad(1)\)
where \(\mu_{i,j}\) is the force of mortality at age \(i\) in year \(j\). The time-series approach proceeds in two stages:
- We estimate the parameters by fitting to data,
- We forecast the estimated \(\kappa\) parameters.
The key point here is that these are two quite separate computations: the method is fit then forecast, where the critical word is then.
Penalty forecasting is very different: the method is fit and forecast simultaneously. Thus forecasting is built into the model (unlike the Lee-Carter approach, where forecasting is added onto the model). Figure 1 shows log mortality for Swedish males age 70 from 1960 to 2010. The observations wander around but there is a clear underlying trend. We will model this trend with a smooth function. The lower panel of Figure 1 shows a B-spline basis with 13 B-splines; there are knots at 1960, 1965, …, 2005, 2010. We compute the regression matrix \(B_y\), 51×13, by evaluating each year in turn at each basis function. The blue dashed line shows the result of fitting the standard generalized linear model with log link, Poisson error and regression matrix \(B_y\). The fitted curve looks a bit too flexible, however, as though it is modelling some noise as well as the underlying trend.
Figure 1: Upper panel: observed log mortality for Swedish males age 70 from 1960 to 2010 with fitted B-spline regression and P-spline smooth.
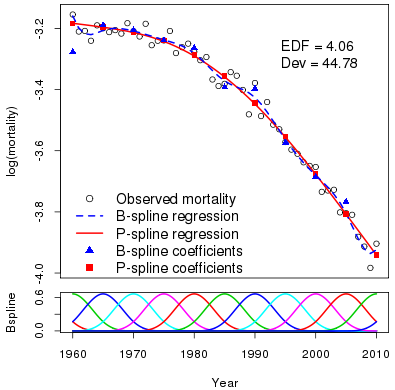
This is where the Eilers and Marx (1996) method of P-splines comes in. They observed that the reason the fitted curve is too flexible is that the fitted coefficients (the blue triangles) are too flexible and they suggested that this could fixed by using penalized likelihood:
\(\ell_p(\boldsymbol{\theta}) = \ell(\boldsymbol{\theta}) - \lambda \boldsymbol{\theta}^\prime \boldsymbol{P} \boldsymbol{\theta}\qquad(2)\)
where \(\boldsymbol{\theta}\) is the vector of regression coefficients, \(\boldsymbol{P}\) is a penalty matrix, \(\ell(\boldsymbol{\theta})\) is the usual log likelihood and \(\lambda\) is a smoothing parameter tuned to the flexibility of the fitted curve. The fitted curve now depends not only on the fit, as represented by \(\ell(\boldsymbol{\theta)}\), but also on the smoothness of the regression coefficients, as represented by the term \(\lambda\boldsymbol{\theta}^\prime \boldsymbol{P}\boldsymbol{\theta}\).
The choice of smoothing parameter \(\lambda\) balances fit on the one hand with smoothness on the other. The focus of this blog is forecasting, so we will not go into the choice of \(\lambda\) here; see Currie, Durban and Eilers (2004) for a detailed discussion. Figure 1 shows the result of maximizing \(\ell_p(\boldsymbol{\theta)}\) in Equation 2 for an appropriate choice of \(\lambda\). The fitted regression coefficients have been smoothed and a smooth fitted curve is obtained. The effective dimension (a measure of flexibility of the fitted curve) is 4.06 and the deviance (a measure of fit) is 44.78. The corresponding figures for the unpenalized B-spline regression are 13 for the effective dimension and 34.87 for the deviance, which indicate a more flexible and better-fitting curve.
Suppose we wish to forecast to 2030. We treat forecasting as a missing-value problem and use the model to estimate the missing mortalities. We invent dummy deaths and exposures for years 2011 to 2030, and a corresponding weight vector which gives the real data weight 1 and the fictitious data weight zero. The weight vector ensures that the dummy data make no contribution to the measure of fit; this way, when we compute the log likelihood over all our data (real and dummy values) we obtain the same value of \(\ell(\boldsymbol{\theta})\) as when we include only the real data.
What about the penalty term in Equation 2? We first extend the B-spline basis to 2030. The use of extend is very precise and the lower panel in Figure 2 shows the full basis. The part of this basis for the data region is precisely the same as in Figure 1. The question is: can we choose the forecast coefficients in such a way that the penalty function also has the same value (as the log likelihood already has) with or without the dummy data? If the answer is "yes", then we have our forecast! It turns out that, for a particular choice of \(\boldsymbol{P}\), the forecast coefficients will not contribute to the penalty if they are a linear extrapolation of the last two coefficients in the data region. The forecast log mortalities and coefficients are shown in Figure 2.
Figure 2: Fit and forecast of log mortality with fitted and forecast coefficients to 2030.
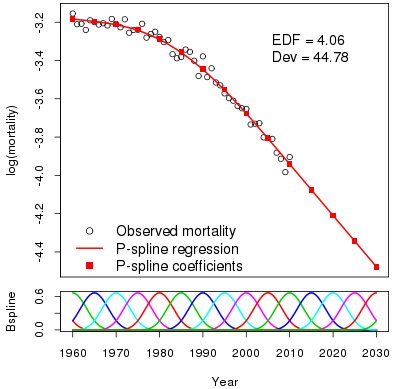
Figure 2 repays careful study:
- The forecast is initially slightly curved (this is scarcely noticeable to the naked eye) since the effect of the final data coefficients leaks into the forecast region. After about 2015 the forecast is precisely linear. I find this a very attractive property. The curvature lives on into the forecast region but dies off after a few years, ie, we have a smooth passage from a curve to a line.
- The role played by the distance between knots is emphasized. In our example, this distance is 5 years. The forecast is essentially a linear forecast of the final two coefficients. If we set knot separation to 10 years we still use the final two coefficients but the "first" coefficient is now at 2000 instead of 2005. Thus the forecast is linked to knot separation, ie, with how far back in the data we go. Small separation gives a forecast that is very responsive to the immediate past; a large separation gives a more robust forecast. The choice is yours!
- Invariance. Figures 1 and 2 and their underlying statistics have some attractive invariance properties. The fitted values, the effective dimensions and the deviances are identical in both diagrams. In this respect, we have the same properties as a time-series model, where the invariance is guaranteed by the two-stage nature of the method.
- Computationally, penalty forecasting is very attractive, since the same computer code is used whether we fit to data alone, or fit to data and forecast.
In our next blog, we will discuss two-dimensional model fitting and forecasting with penalties. All the above ideas will apply — but there are complications. You have been warned!
References:
Currie, Durban & Eilers (2004). Smoothing and forecasting mortality rates, Statistical Modelling, 4, 279–298.
Eilers & Marx (1996). Flexible smoothing with B-splines and penalties, Statistical Science, 11, 89–121.
Human Mortality Database. University of California, Berkeley, USA. Available at www.mortality.org (data downloaded 2015).
R Core Team, (2014). R: A Language and Environment for Statistical Computing, R Foundation for Statistical Computing, Vienna.
Add new comment