A benchmark for longevity swap prices
What should a reinsurer charge for longevity risk? Is it possible to benchmark longevity swap prices? One answer to these questions comes from an unlikely source: European Solvency II.
In recent years, longevity swaps have become a popular instrument in the U.K. for managing the longevity risk inherent in portfolios of pensions and annuities. The insurance company or pension scheme replaces uncertain future benefits paid out to pensioners or annuitants with a schedule of fixed reinsurance premiums. The reinsurer takes on the responsibility to pay the actual benefits and receives the fixed reinsurance premiums in return. These premiums will reflect the reinsurer’s best estimate of future cash flows, i.e. the survivorship of the portfolio in question, plus a margin as compensation for taking on the risk. The key question is: how to evaluate the margin?
Conceptually, reinsurers have to hold capital against the risk which they take on when entering into a transaction. Naturally, each reinsurer will have its own basis for calculating capital requirements, and also a separate basis for allocating capital. Each reinsurer will also have its own unique return requirements. Enter Solvency II: The new European solvency regime puts forward a uniform, risk-based approach for calculating capital, and also stipulates an average cost of capital across the entire European insurance landscape. This is a very bold case of averaging, but it nevertheless gives us a benchmark: the Solvency II Risk Margin (S2RM), which is fixed at 6% of the discounted Solvency Capital Requirements (SCRs). Furthermore, Solvency II comes with a basic model referred to as the "Standard Formula", which companies have to use if they don't want to go through the process of getting regulatory approval for their own internal models.
Let's look at how the SCR and S2RM are calculated in an example:
- Consider some pensions paid to a group of 70-year-old males in the UK with the same mortality characteristics. Using the industry table S1PA in conjunction with a constant mortality-improvement rate of 1.75% per year, we project the survivorship.
- We calculate the best-estimate liabilities at outset and every subsequent year, discounting with risk-free interest rates. For a total pension of £100,000 p.a. the best-estimate liability value at outset roughly equates to £1.28 million.
- The longevity stress according to the Solvency II standard formula simply changes the mortality assumption to 80% of best-estimate assumptions. The resulting SCR, which is the difference between best-estimate and stressed liabilities, is £114,000 at outset and then falls in absolute terms, as shown in Figure 1 below.
-
The S2RM is then calculated as 6% of the present value of the SCR values in each year. The factor of 6% is the current standard cost-of-capital factor under Solvency II. The run-down of the S2RM with elapsed time is also shown in Figure 1.
Figure 1: Solvency Capital Requirement (SCR) and risk margin for a longevity swap under the Solvency II Standard Formula.
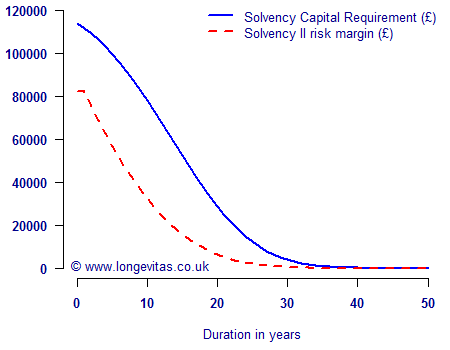
The S2RM in our example amounts to approximately £82,000. This is equal to 6.46% of the best-estimate liability value at outset. Table 1 shows the results for a selection of other outset ages.
Table 1: Solvency II risk margin (S2RM) for different ages at outset (as a percentage of the best-estimate liability value).
| Outset age | 60 | 65 | 70 | 75 | 80 | 85 | 90 | 95 |
|---|---|---|---|---|---|---|---|---|
| S2RM | 6.7% | 6.7% | 6.5% | 6.1% | 5.6% | 4.9% | 4.3% | 3.7% |
We can now compare reinsurers’ prices, using the S2RM as a benchmark. We can even compare reinsurers’ capital efficiency with respect to taking on longevity risk by calculating their implied cost-of-capital factor under the Solvency II standard formula. A common benchmark is useful for transparency and can lead to informed discussions between longevity risk sellers and buyers. This is useful because reinsurers will use their own internal models, and will manage to different returns on capital. Even if your own company is not European, it still makes sense to compare your price to this benchmark, in particular if your transaction counterpart — or your competition! — is European.

Add new comment