Concentrate!
One of the challenges in modelling financial portfolios is the concentration of risk arising from the fact wealthier people will usually have significantly higher benefits than the less well-off.
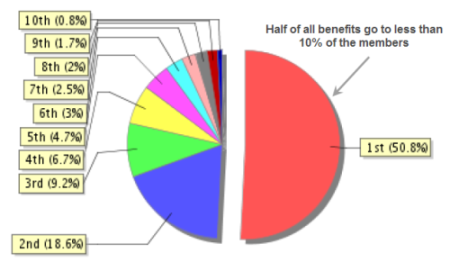
In a small annuity or pension scheme, the stochastic risk (the risk surrounding who dies when) can be highly significant, often the most significant risk the scheme runs. Here is an analysis of one small portfolio, showing a not untypical concentration of risk.
It is unsurprising that there is demand to analyse such an important characteristic in a multiplicity of ways. One technique we have introduced recently is geographic heatmap analysis.
This is a visualisation technique that allows us to map the spread of liabilities in any portfolio across a map (in this instance, of the UK). We do this at the postcode district level - aggregating members and benefits for a single district, before plotting a point whose colour reppresents the value of the aggregate.
This is perhaps clearest if we give an example. Taking the same small portfolio that generated our pie chart above, we create a geographic heatmap that looks something like this:
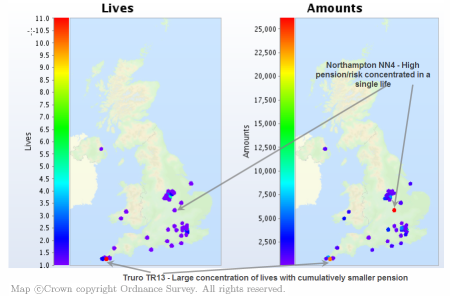
What is interesting here is to contrast the lives and amounts weighted analysis as shown by our annotations. Little wonder that over half our benefits are held by 10% of our members when the combined pension of 11 members in Truro are outweighed by that of a single individual in Northampton!
Add new comment