From magical thinking to statistical thinking
The Institute and Faculty of Actuaries in the UK has recently added mortality projection to its syllabus, so this year I have been teaching the subject for the first time to students at Heriot-Watt University.
As an exercise, I asked the students to imagine they were an actuary back in 1980, and to first fit a Lee-Carter model to data from the Human Mortality Database for males in England and Wales, 1940–1980. Then the students had to project the fitted mortality surface forward 25 years, to 2005. This is easily done using some R programs written by Iain Currie for our recent book, Macdonald, Richards and Currie (2018). The programs Lee_Carter.rLee_Carter.r and Forecast_LC.rForecast_LC.r referred to there are freely available from the publisher's website at www.cambridge.org/9781107045415.
Figure 1. The results, at age 60, of fitting a Lee-Carter model to England and Wales data, males, 1940–1980, and projecting mortality ahead to 2005.
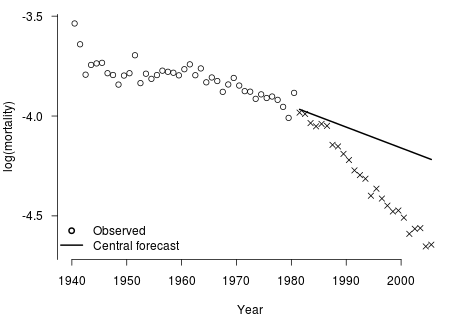
Then, because we do know what happened between 1980 and 2005, we can compare the projections with the actual outcome. Figure 1 shows the results, taking age 60 as an example. We can see that the projection (straight line) looks like a sensible effort, given the past observations (circles), but that reality (crosses) turned out to be very different.
The interesting question is then, did the Lee-Carter model do a good job or a bad job at forecasting mortality, from the point of view of an actuary pricing annuity business back in 1980? The students know that over-stating mortality is financially bad for annuity business, so most would say "a bad job". And indeed, if we interpret the projection as an attempt to predict 25 years ahead and get the right answer, they have a point.
But who on earth can forecast 25 years ahead and expect to get the right answer? Or even hope to get the right answer, fingers crossed and touch wood? This is magical thinking. It certainly is not statistical thinking.
The actuary in 1980 had very limited tools for measuring and managing risk, so outcomes like Figure 1 did transpire, perhaps giving deterministic mortality forecasting a bad name. But nowadays actuaries have stochastic tools, the Lee-Carter model among them. A major difference between a deterministic and a stochastic model is that the latter provides not just `best estimate' predictions but a measure of how much uncertainty there might be about such predictions. One such measure is a prediction interval, loosely speaking an interval which should contain the actual outcome with stated probability.
Figure 2. The results, at age 60, of fitting a Lee-Carter model to England and Wales data, males, 1940–1980, and projecting mortality ahead to 2005, with 95% prediction intervals shown.
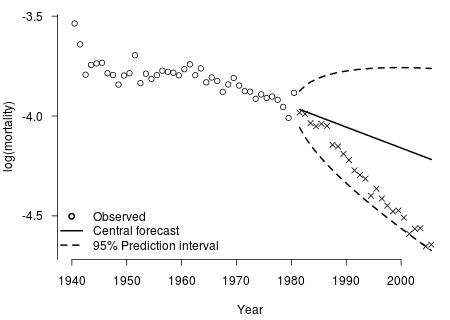
Figure 2 shows what the actuary would have seen in 1980, had she been able to add 95% prediction intervals to the diagram (for details see Chapter 13 of our book). The picture is transformed. If we now interpret the projection as an attempt to map out a region within which future mortality may evolve, with stated probability, we have a basis for quantitative risk management. And, had the Lee-Carter model been available in 1980, it would arguably have done rather a good job. Not of predicting the future, but of giving the actuary a plausible statistical basis for financial risk management — a starting point at least.
I am not advocating the use of the Lee-Carter model in particular (indeed, Figure 6 in Currie, Durban and Eilers (2004) shows a similar result using a P-spline model fitted to CMI assured-lives data). It just happens to furnish a nice example to illustrate a point. That point being that a stochastic model leads us towards thinking about risk, uncertainty, how to measure it and how to manage it. Then we can leave deterministic forecasting to wizards and witches.
References:
Currie, I. D., Durban, M. and Eilers, P. H. C. (2004). Smoothing and Forecasting Mortality Rates, Statistical Modelling, 4, 279–298.
Macdonald, A. S., Richards. S. J. and Currie, I. D. (2018). Modelling Mortality with Actuarial Applications, Cambridge University Press.

Add new comment