Longevity and the 2011 Census
The Continuous Mortality Investigation (CMI) has just announced its decision to postpone the release of its mortality projection model until 2013, the main reason being to properly allow for the impact of the 2011 Census. This deferral is very sensible as the 2011 Census has revealed some significant results for those with an interest in longevity.
On 16 July 2012 the Office for National Statistics (ONS) published population estimates for England & Wales based on information gathered in the 2011 Census. The headline was that the revised population estimate based on the recent census was just under 0.5 million higher than the previous population estimate (rolled forward from the 2001 Census).
However, closer examination of the figures reveals some notable findings. In particular, the 2011 Census appears to generate much lower population estimates at very high ages. Figure 1 gives the percentage change by age group between the population estimates before and after the publication of the 2011 Census results. The most striking feature of the data is the significant downward revisions in population estimates at ages of 90 and above, especially for males aged 90–99 and females aged 100+. Figure 1 illustrates that for males aged in their 90s, for example, the population estimates appear to be around 15% lower than previously thought.
Figure 1. Percentage change in England & Wales population estimates following publication of the 2011 Census results, by age group & gender. Source: Friends Life.
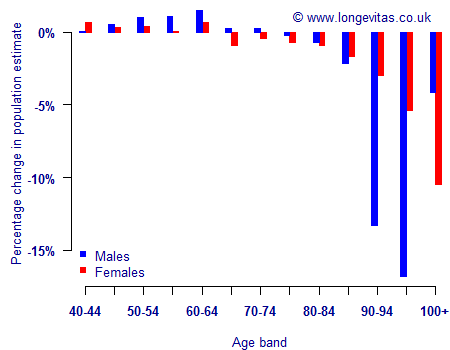
The most obvious implication is that mortality rates for the population of England & Wales at ages above 90 appear to be higher than previously thought. This means that life expectancy at age 65 should be slightly lower. However, a further implication of the apparent understatement of mortality rates at high ages is that the recent pace of improvement at those ages will have been over-stated. This is illustrated in Figure 2.
Figure 2. Average annual rate of mortality improvement by age group for males in England & Wales, 2001–2011, calculated using two different approaches to deriving mortality rates for 2011. Source: Friends Life.
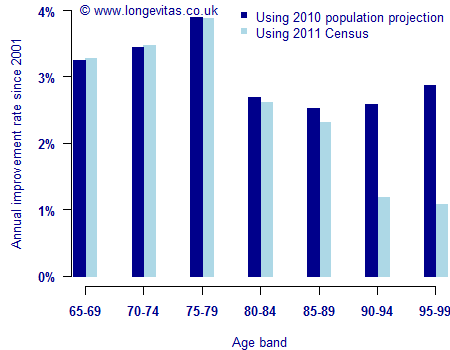
Figure 2 shows average annual rates of improvement over the period 2001–2011 calculated in two ways:
- With improvements based on mortality rates for 2011 derived using actual deaths for 2011 and mid-year populations taken from the latest ‘2010-based’ ONS projection.
- With improvements based on mortality rates for 2011 derived using actual deaths for 2011 and mid-year populations derived using the 2011 Census estimates.
In both cases it is assumed that population estimates for 2001, and hence mortality rates for that year, are correct for all age groups. The striking feature of Figure 2 is that the 2011 Census results suggest that recent rates of improvement may have been far lower at high ages than previously thought. For males in their 90s, for example, the pace of change may have been less than half as rapid.
It is likely that updated population estimates produced using the 2011 Census will result in slightly lower life expectancies (at age 65). The precise impact will not be known until official 2011 mid-year estimates are published by the ONS in September and revisions to 2002-2010 population estimates are released later in the year. It is also probable that projections of the population reaching high ages, e.g. projected numbers of centenarians or the likelihood of reaching age 100, may be more materially effected.
More generally, the publication of initial results from the 2011 Census demonstrates:
- The ongoing value of the 10-year census in helping us to measure mortality trends as accurately as possible; and
- The need for caution when using population-based mortality measures or indices.
In the case of the population of England & Wales (or the UK) estimates are based on rolling forward 10-year census results, and the potential for over- or under-estimation of the population in the intervening years should not be discounted.
An implication of the apparent revision is to alter our perception of how improvement rates might vary by age in the future. Recent data appeared to indicate very high rates of change at advanced ages, which provided a challenge for models which implicitly assumed less rapid rates of change beyond certain ages (e.g. the CMI Core Projection model beyond age 90). The revised population estimates suggest there may be less evidence for this challenge.
Those concerned with the analysis and management of longevity risk should await further publications from the ONS with interest!
References:
Richards, S. J. (2010) "Detecting year-of-birth mortality patterns with limited data", Journal of Royal Statistical Society (Series A), 171 (1), pages 1-20.

Comments
Any comments on:
1. What has caused the over-estimation of population above age 90?
2. What is the uncertainty around the most recent census or any census count?
Good questions.
I'm not exactly sure what has caused the possible over-estimation. However, I imagine that rolling-forward population estimates at high ages is a pretty tricky thing to get right. If your population estimate one year is a little too high then the mortality rate for that year will be under-stated. This will then mean that your population estimate for the following year will be even more over-stated. And so on. As a result, a slight discrepancy may become bigger and bigger over time.
And your question about uncertainty is a good reminder that even on census dates the population estimates are not 100% accurate. I believe response rates are circa 90%, but this means that assumptions need to be made for non-respondents and it may be difficult to get these assumptions right across the whole age range. I can't remember seeing anything quantifying levels of uncertainty, but it would be interesting if this has been done.
I believe I have an explanation...
The birth cohorts corresponding to the worse differences in estimates are the ones born around the WWI, which suffered huge declines in live births, as a result, I believe, both from war and Influenza.
Projections over 10-year differences in time of birth (say, 90 years of age in 2001 and the same age in 2011) are expected, in these cases, to result in huge mistakes...
For the live births trends in UK, see
http://www.actuaries.org.uk/research-and-resources/documents/influenza-…
Maria's point is that it is very difficult to estimate the population where there are wild swings in the numbers of births, as shown below:
Births per quarter in England & Wales between 1914 and 1925. Source: Richards (2010).
https://longevitas.staging.civiccomputing.com/sites/default/files/inlin…
The peak is 270,965 births in the first quarter of 1920, which is almost double the number just one year previously. Estimating population numbers at round ages for this generation is therefore particularly tricky!
References
Richards, S. J. (2010) "Detecting year-of-birth mortality patterns with limited data", Journal of Royal Statistical Society (Series A), 171 (1), pages 1-20.
I agree that the uneven pattern of births has a distorting influence on mortality rates and this makes the exercise of projecting the population more difficult. However, the discrepancy for the 90-94 age group is much higher for males than females of that age (13% vs 3%). The pattern of births from quarter to quarter is going to be pretty similar for males and females. Does that imply another factor is involved?
Well, the cohorts born around the WWI supported the greatest burden of WWII related deaths, expectedly much higher for men?
Forgive a question from a complete amateur, but my reading of this, the links and today's FT suggests that between each census, the population of each age band is unknown, and estimated? I assume there is knowledge of how many of each age band die each year, but to get the qx values I see in ONS reports am I right in thinking these are coming from estimated population counts for each age band? Is there anywhere that reports the uncertainty of such estimates?
Deaths data in the UK are collected continuously and are of high quality and reliability. There is an essentially weekly feed of death counts from the various registrars' offices around the country.
The population figures are very different, however. These are estimates, based on decennial census information and adjusted for issues related to transient groups and under-reporting. The further you are from the last census, the greater the uncertainty in the population estimates. There are then further technical challenges in estimating the population exposed to risk at each age.
These issues are covered in Richards (2010), but much more detail can be found in various ONS publications.
I only just came across this blog after a tip off from a colleague. Interesting.
To check this out I downloaded the current mortality.org data for EW up to 2009 and plotted the crude m(x)'s on a log scale for 2009. Sure enough you can see (a) the abnormal blip for the 1919 cohort but then for higher 90+ ages the death rates look abnormally low. On a log scale you can fit a straight line on, say ages 75 to 89 that lies significantly above the 90+ death rates. By eye and adding a few additional parallel lines, the 90+ death rates might be as much as 20% too low.
On the other hand this is tempered by the presumably overestimated exposures from earlier in the decade, when it comes to estimating the improvement rate.
Tracing things back, if you divide data on either side of the "notorious" 1919 birth cohort then you can convince yourself that a possible problem with the exposures for 1919 and earlier cohorts exists further back than the 2001 census.
Add new comment