Occupational hazard
We previously considered Sir Michael Marmot's landmark Whitehall Studies, which looked at health and mortality outcomes for UK civil servants. Sir Michael continues to research UK mortality, and has recently been drawing attention to the fact that improvements in UK life expectancy appear to be slowing down. Since 2010, life expectancy, previously increasing at around one year for every four, appears to have down-shifted to one year in every six-and-a-half for men, and every ten for women. The big question, of course, is why?
It goes without saying that national populations are never homogeneous. We've seen evidence of this both within US subpopulations and between different areas in the UK. It is therefore always helpful to analyse data in multiple ways to try and isolate the potential drivers of any particular effect. In October 2017 one research team published an analysis of mortality rates by occupational group, using census-linked mortality records. It was the first such detailed study in the UK since the 1970's.
The occupational analysis attempted to look at mortality rates by comparable occupational groups across the UK. It used longitudinal data from ONS for England & Wales, the Scottish Longitudinal Study and the Northern Ireland Mortality Study. The differences in occupational mortality rates are eye-opening. The following table shows the mortality multiplier visible between the EASRs (Age-standardised mortality rates per 100,000 person-years) for the highest- and lowest-mortality occupations considered by the study in each UK territory. Note that we've ignored the "no occupation" category which was not available for the Northern Irish data, although that category provided the highest EASR where available in other territories. We've also omitted the highest-mortality SOC code (Animal care services - EASR 1125) for Scottish males due to the absence of comparable data in either the E&W males dataset or in Scotland's 1991 census period.
| Country | Gender | High mortality(EASR) | Low mortality(EASR) | Multiplier |
|---|---|---|---|---|
| England & Wales | M | Elementary construction occupations(701) | Health professionals(225) | 3.16 |
| F | Plant and machine operatives(517) | Culture, media, and sports occupations(133) | 3.89 | |
| Scotland | M | Elementary construction occupations(937) | Health professionals(145) | 6.46 |
| F | Plant and machine operatives(663) | Teaching professionals(160) | 4.14 | |
| Northern Ireland | M | Elementary Personal Services Occupations(639) | Health professionals(137) | 4.66 |
| F | Elementary Process Plant Occupations(339) | Health professionals(95) | 3.57 |
A further key aspect of this study we'll consider here is the additional perspective offered on Scotland's excess mortality within a UK context. A striking element of the analysis is the difference in calculated rates between England & Wales and Scotland moving from occupations with the highest to the lowest mortality rates. We've ordered the Scottish occupation data by mortality rate, and plotted the difference with the E&W rate for the matched SOC code.
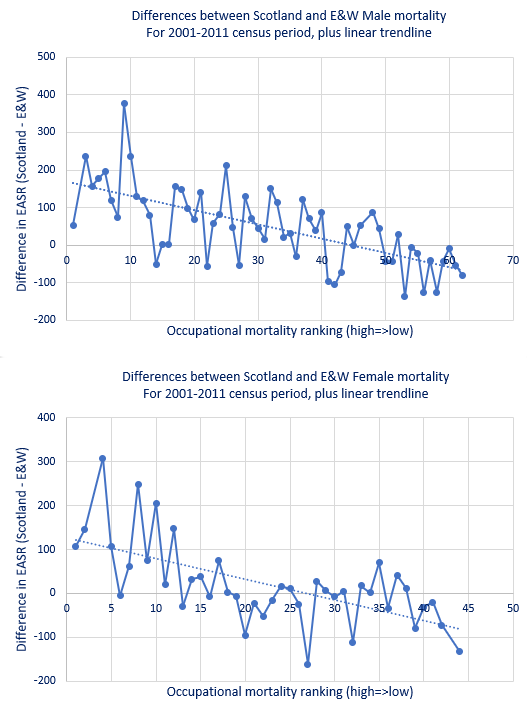
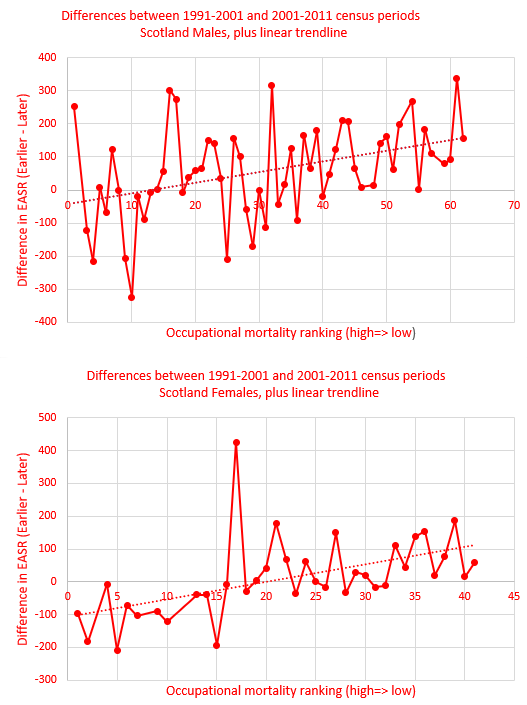
What is most obvious here is that the excess mortality effect is glaring at one end of the ranking, whilst being more or less absent at the other. This might be an illustration of Scotland's proposed greater vulnerability to the stresses of poverty. Another interesting finding is the extent to which these higher mortality occupations have shown negligible or negative improvements. This is illustrated in the following charts showing the change in mortality rates between the 1991-2001 and 2001-2011 census observation periods for males and females in Scotland. The linear trend clearly suggests the highest mortality occupation groups are the ones where the rates have improved the least.
This research is based on self-reported occupation at the time of the census and a lot can happen within a decade that isn't captured by that point-in-time categorisation. In addition self-reported occupation clearly acts as a proxy for a variety of stresses and behaviours associated with social class. However, the study offers valuable insights and more research is required to unpick precisely what is going on. In both US and UK contexts, excess mortality seems concentrated in psycho-social causes. Researchers are already considering the relationship between precarious employment and mental ill-health as these studies on Italian and Swedish data illustrate. With precarious employment reportedly on the rise within the UK, it is natural to ask whether this might be one factor driving the observed national shift in mortality improvements and life expectancy?
References:
Katikireddi, S.V. et al. (2017) Patterns of mortality by occupation in the UK, 1991-2011: a comparative analysis of linked census and mortality records. The Lancet Public Health, Volume 2, No. 11, e501-e512, November 2017 DOI: http://dx.doi.org/10.1016/S2468-2667(17)30193-7
Moscone, F. Tosetti, E. Vittadini, G.(2016) The impact of precarious employment on mental health: The case of Italy. Social Science & Medicine, Volume 158, June 2016, Pages 86-95 DOI: https://doi.org/10.1016/j.socscimed.2016.03.008
Canivet, C. et al. (2016) Precarious employment is a risk factor for poor mental health in young individuals in Sweden: a cohort study with multiple follow-ups. BMC Public Health., 2016; 16: 687. DOI: 10.1186/s12889-016-3358-5
Add new comment