Pensioners — the youth of today
This blog focuses on two particular features of mortality improvements: improvements around retirement age and improvements for the (very) old. Figure 1 shows \(\mu_{x,1961}/\mu_{x,2012}\), the ratios of the forces of mortality over the ages \(x = 50,\ldots,95\), in 1961 and 2012 for four countries. The figure was obtained as follows: data for ages 50–95 and years 1961–2012 were downloaded from the Human Mortality Database and the raw 2D mortality table was smoothed using 2D P-splines (see my earlier blog for details on 2D smoothing with P-splines). The ratios plotted in Figure 1 were obtained from the resulting smooth mortality surface.
Figure 1. Mortality ratios, \(\mu_{x, 1961}/\mu_{x, 2012}\), for UK, USA, Netherlands and Japan for ages 50–95.
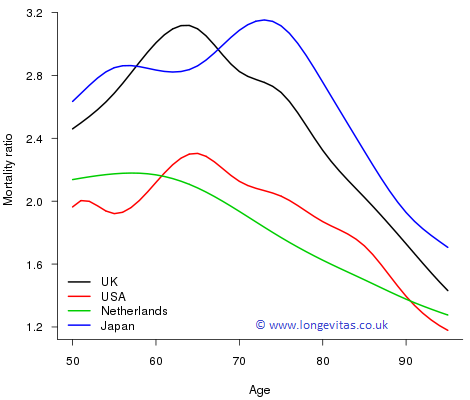
The UK and Japan have seen the greatest improvements with the maximum improvement in the UK occurring around age 65, precisely the UK state retirement age! For these two countries the ratio has a maximum in excess of 3; in the USA and Netherlands the maximum ratio, while lower, still exceeds 2. One way of putting these improvements in perspective is to note that for UK males, for example, the force of mortality of a 65-year-old in 2012 was the same as that of a 54-year-old in 1961. Verily, the pensioners of today are the young of yesterday!
One other striking feature in Figure 1 is that at older ages the ratios are monotonic decreasing with age for all four countries. From a naive numerical perspective older ages with their high mortality offer the greatest potential for improvement; however, these larger improvements simply do not happen in practice. Modern medicine, changes in lifestyle, social policy and general improvements to standards of living all contribute to improvements to mortality, but their impact is greatest around ages 65–75 and falls away steadily with increasing age. These drivers for improved mortality seem to run into a brick wall at older ages and, at these higher ages, mortality is more and more simply decided by age, and there is less and less society or the individual can do about it!
Figure 1 shows improvements to mortality. Perhaps the greater improvements of the UK and Japan are partly a consequence of a poor base mortality in 1961. Figure 2 bears this idea out. The UK and Japan both had heavier mortality then, particularly relative to the Netherlands.
Figure 2. Male mortality, \(\log \mu_{x,1961}\), for UK, USA, Netherlands and Japan for ages 50–95.
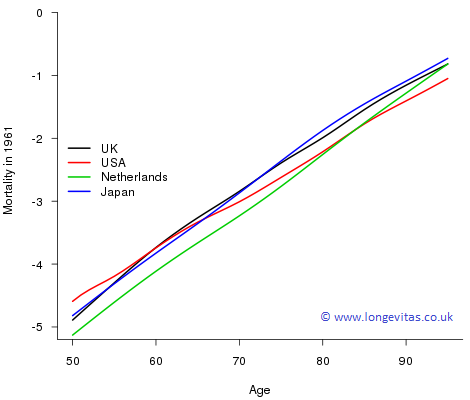
While slightly off-topic, we can't resist commenting on the striking pattern for the USA in 1961. At younger ages the USA had very poor mortality at that time but things switch right around at very old ages where those that are left have the best mortality. This leads us neatly into frailty models of mortality. The idea here is that the force of mortality for an individual is determined not only by their age, \(x\), but also by their frailty, \(z\); now the force of mortality is denoted by \(\mu_x(z)\). One simple model proposed by Vaupel et al. (1979) is that \(\mu_x(z) = z \mu_x\). Under this model the mortality pattern for the USA in 1961 in Figure 2 is explained by a high proportion of the population having large values of \(z\) (die early); those that remain are the select group with low values of \(z\). We will return to frailty ideas in a subsequent blog.
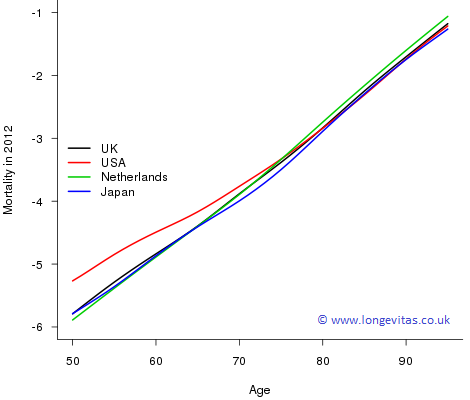
To complete the picture, Figure 3 shows where we are now. Mortality in the USA for ages less than 75 is still relatively poor with the mortality of those in their fifties very much poorer. Japanese mortality for those aged 65–80 is better than our other three countries, while for the very old it is the Dutch who lag behind. For those interested in a wider comparison, Pritchard & Wallace (2001) compared the effectiveness of healthcare systems in reducing mortality rates.
Figure 3. Male mortality, \(\log \mu_{x,2012}\), for UK, USA, Netherlands and Japan for ages 50–95.
In this blog we have focused on two features of mortality improvements: the ages of greatest improvements and the improvements for the very old. From the immediate actuarial perspective, the greatest improvements, particularly in the UK, occur just where they will have the greatest impact on pensions and annuity profitability. For the very old, mortality improvements are harder to come by. But who knows what impact regenerative medicine may have on old-age mortality some time in the future? If these impacts are anything like the changes we have seen to the mortality of those that we might call the "new middle age'", then we are in for some very interesting times.
References:
Human Mortality Database. University of California, Berkeley, USA. Available at www.mortality.org (data downloaded August, 2016).
R Core Team, (2016) R: A Language and Environment for Statistical Computing. R Foundation for Statistical Computing, Vienna, Austria. URL https://www.R-project.org/.
Pritchard, C. and Wallace, M. S. (2011) Comparing the USA, UK and 17 Western countries' efficiency and effectiveness in reducing mortality, Journal of the Royal Society of Medicine Short Reports, 2(60).
Vaupel, J. W., Manton, K. G. and Stallard, E. (1979). The impact of heterogeneity in individual frailty on the dynamics of mortality, Demography, 16, 439–454.
Add new comment