Personal standards
Love them or loathe them, actuaries cannot get by without standard tables in some shape or form. Even when performing analysis of your own experience data to avoid basis risk, standard tables are often used as a kind of lingua franca between parties, a convenient way to express approximate results in a way everyone can understand.
The use of standard tables in experience analysis brings its own issues of course: Mortality moves on after a table is published, and even those that are not too outdated may still be innappropriate for the population under study. In any case the rates from a standard table will often require significant transformation in order to achieve something vaguely similar to your actual experience. Despite these concerns, this staple of the actuarial profession isn't going away any time soon.
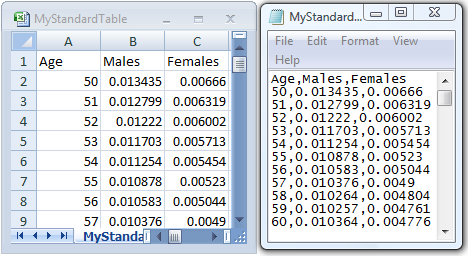
From a systems point of view, a conventional standard table is pretty simple in concept. It is a list of ages, with male and female mortality rates for each age. As a CSV file it woulds look something like this (viewed both as a spreadsheet and simple text:
So, if you are performing a longevity analysis or have projected to a specific year, how can you express results relative to your chosen standard table? The best way is to use the equivalent reserves method as per the SIAS paper, "Financial aspects of longevity risk". A quicker and more visual - although less precise - way is to visually match the curves.
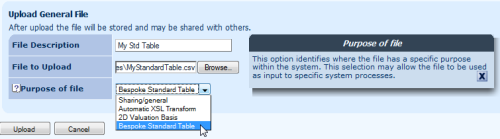
Our tools support the most common standard tables (such as the SAPS, PNA/PCA and the venerable PA92 tables) out of the box, but you can easily upload your own. We treat a standard table as a General (text/csv) file with a purpose of "Bespoke Standard Table", as shown:
When this file is uploaded, you can access it directly from the curves tab of your Longevitas model or Projections Toolkit projection. Here we see the result of visually matching the female experience data under study with the female rates from my personally uploaded standard table.
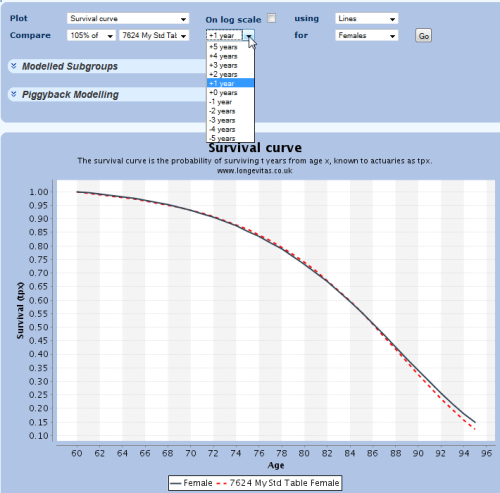
We can get a pretty close visual match using 105% of the female rates using an age rating of +1 year. You can follow the same simple process for any subgroups in your model or years covered by your stochastic projection.
Add new comment