Application walkthrough
Introduction
Longevitas is a new software service for the analysis and management of demographic risks. This web page shows a series of screen-shots from the next production version of Longevitas. A printable PDF brochure can be downloaded here.
1. What is a 'demographic risk'?
In short, anything to do with people and risks. Longevitas can be used for analysing mortality and longevity risks, say for pension schemes and annuity writers. However, it can also be used for persistency and transfer risks, i.e. assessing the influence of risk factors on people's propensity to stop paying premiums, close an account or transfer their funds.
2. Service, not software
2.1 Longevitas is not software that you have to install on your computer. Instead, it is a service accessed over the Internet. If you have a web browser and a broadband connection, you are already set up for Longevitas:
2.2 Longevitas is hosted on our secure, authenticated servers, which incorporate hardware-resilience features such as hot-pluggable hard drives, RAID filesystems and redundant power supplies.
3. Resources
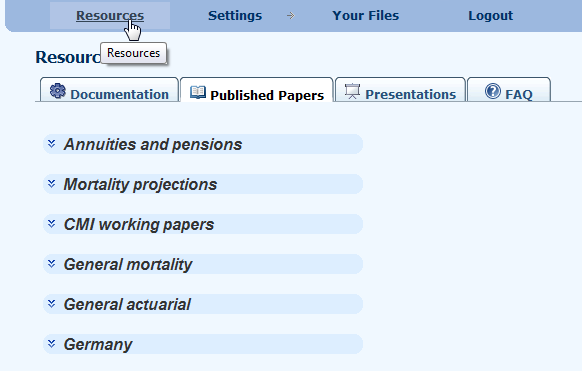
3.1 Longevitas incorporates an extensive Resource library containing links to research papers, presentations, and Application FAQ in addition to documentation and sample data. This library contains both published and private content available only to license holders and is extended on a regular basis.
4. Configuration
4.1 Longevitas is fully configurable for each individual user, with three broad areas of options:
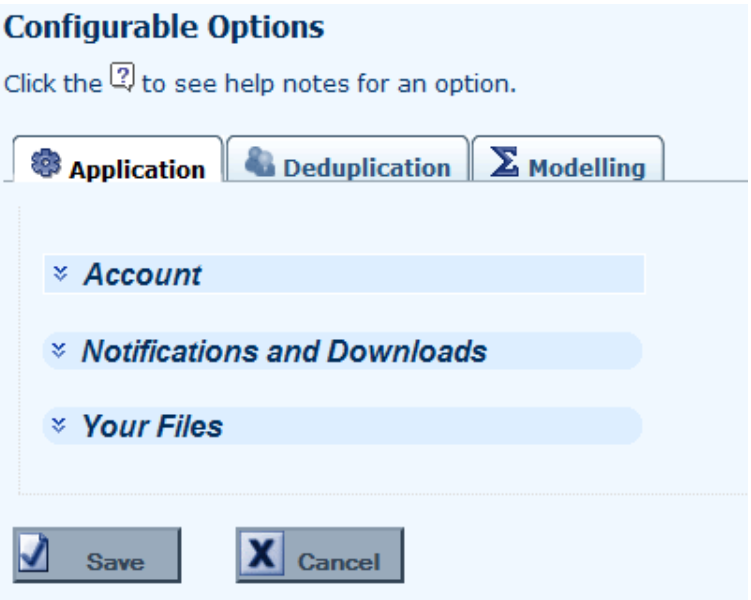
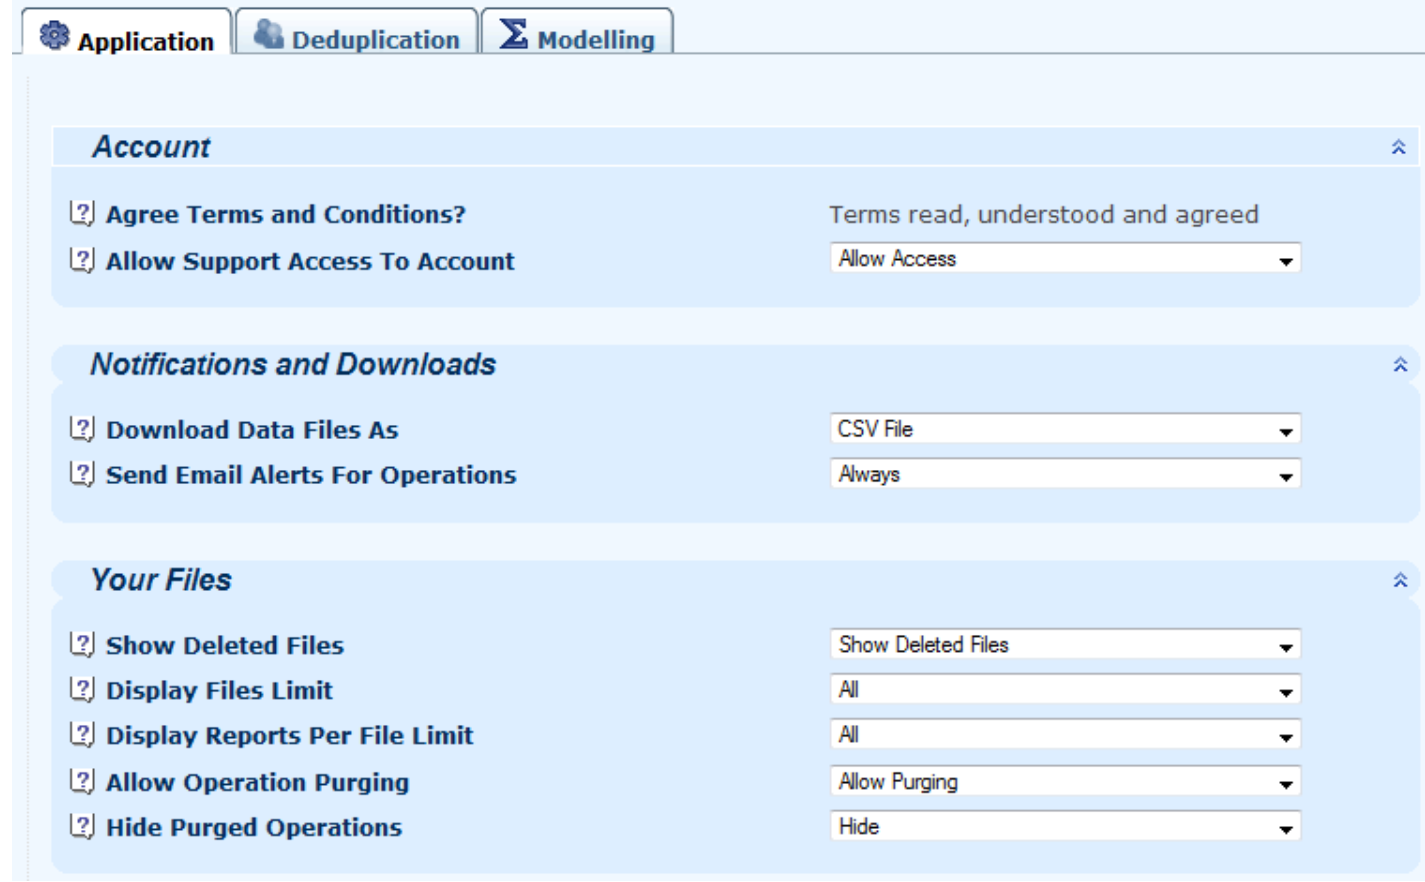
4.2 Application options are to do with user comfort, for example controlling the display of deleted files or reducing bandwidth usage by downloading results as ZIP files:
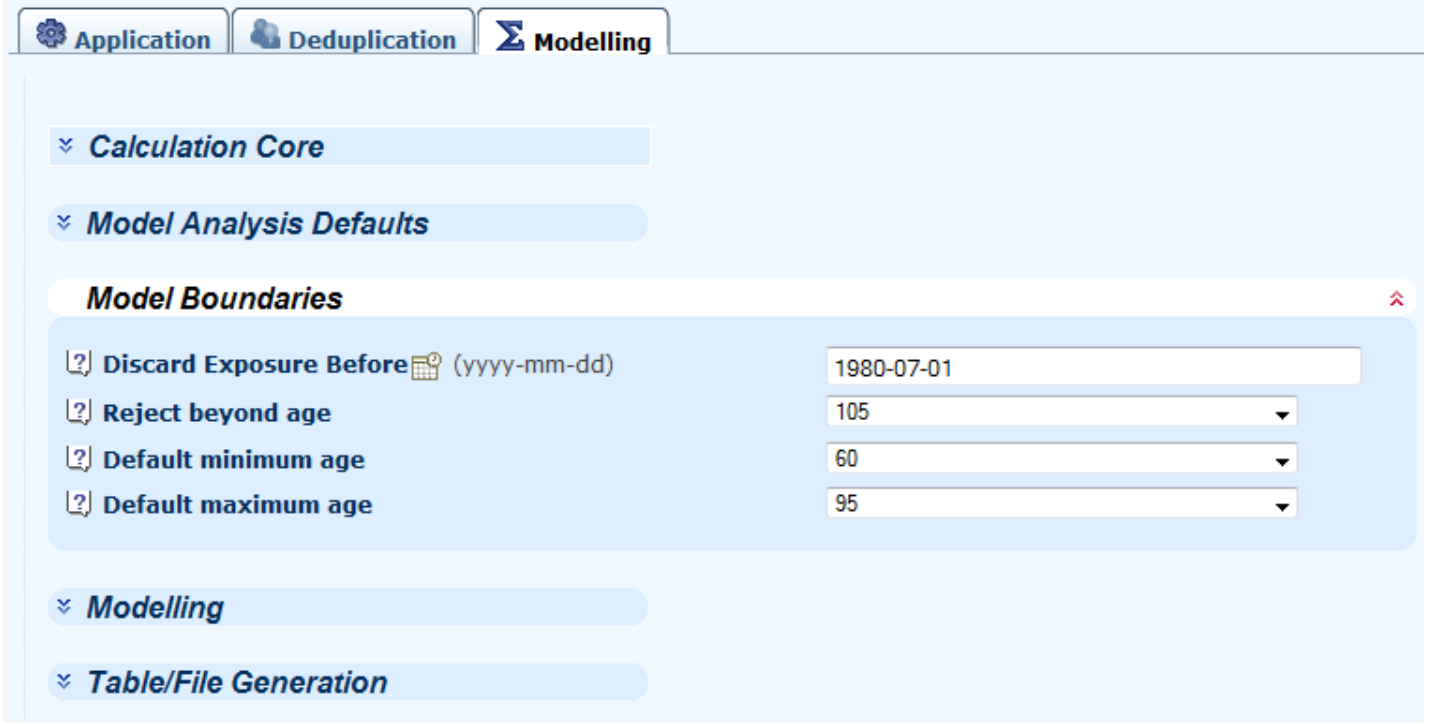
4.3 Modelling options are to do with the fundamental mechanics of the model fitting, for example the default dates and ages for specifying ranges:
5. Uploading a file
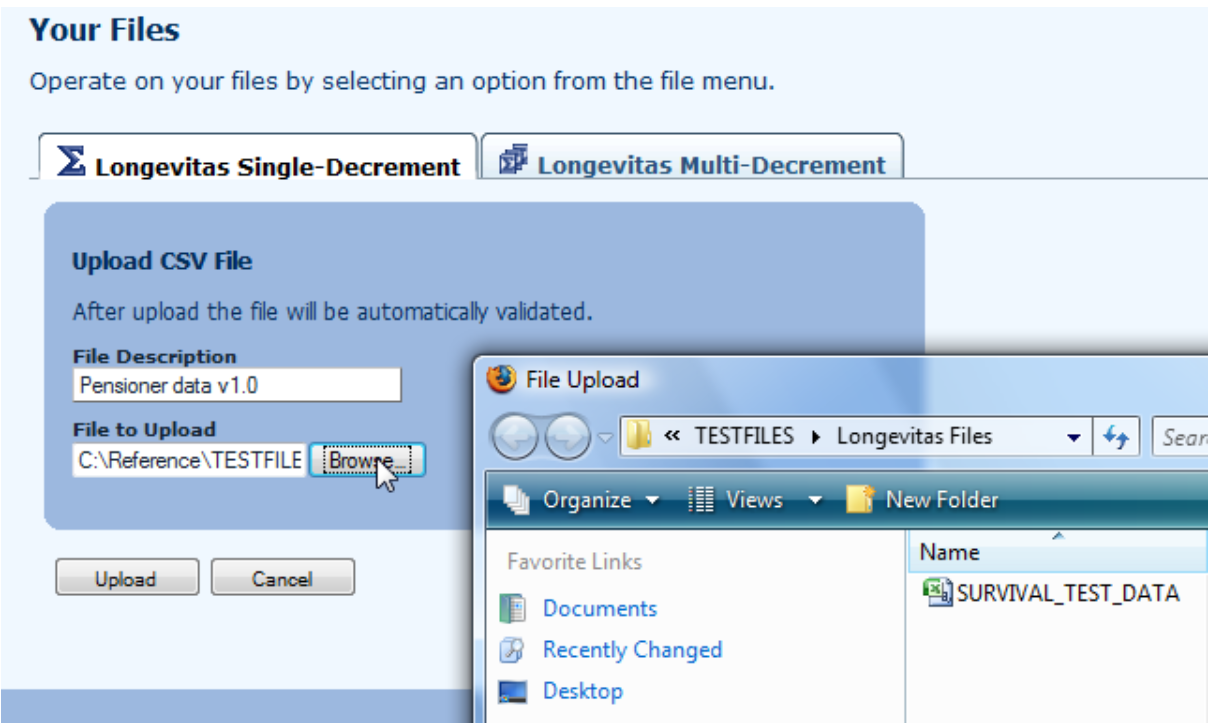
5.1 Data can be uploaded to Longevitas in a comma-separated values (CSV) file.
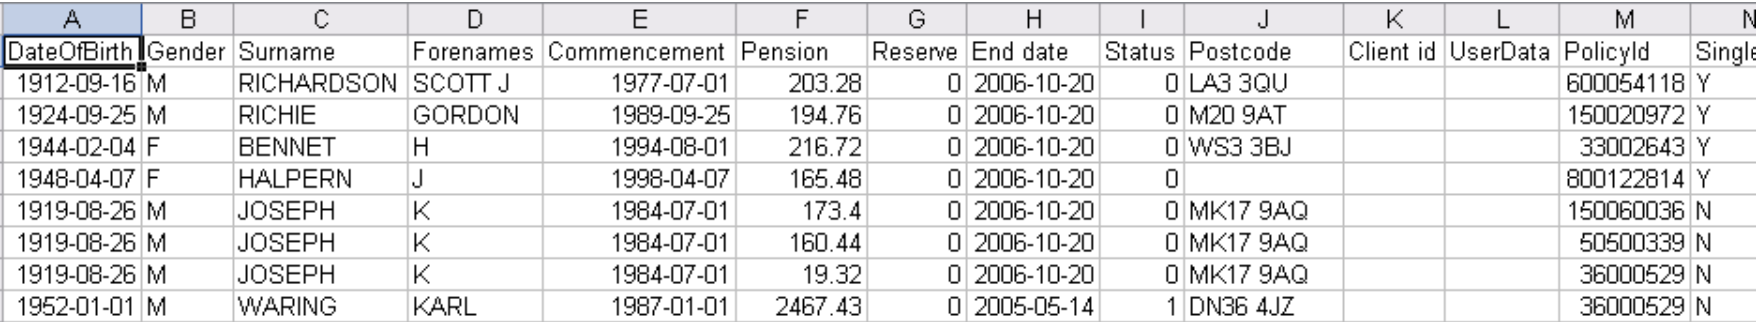
5.2 The first thirteen columns (A-M) have a pre-defined format, but after that you can specify any extra data columns you like.
5.3 Longevitas can handle multiple simultaneous files. There is nothing to stop you running several model fits in the background while you upload a new file:
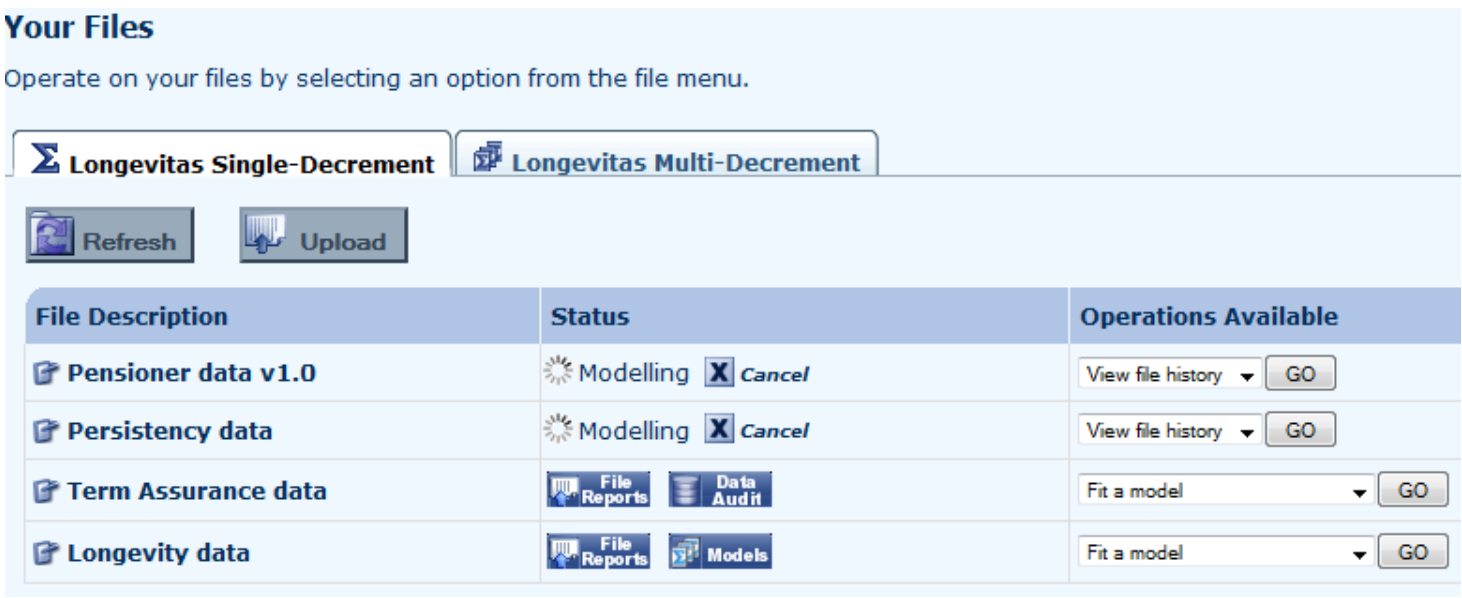
6. Validating a file
6.1 The first step before any modelling can take place is data validation. Longevitas applies a battery of universal sense checks on the data. The results of the validation, including a breakdown of the errors encountered, is displayed automatically after the file is uploaded:
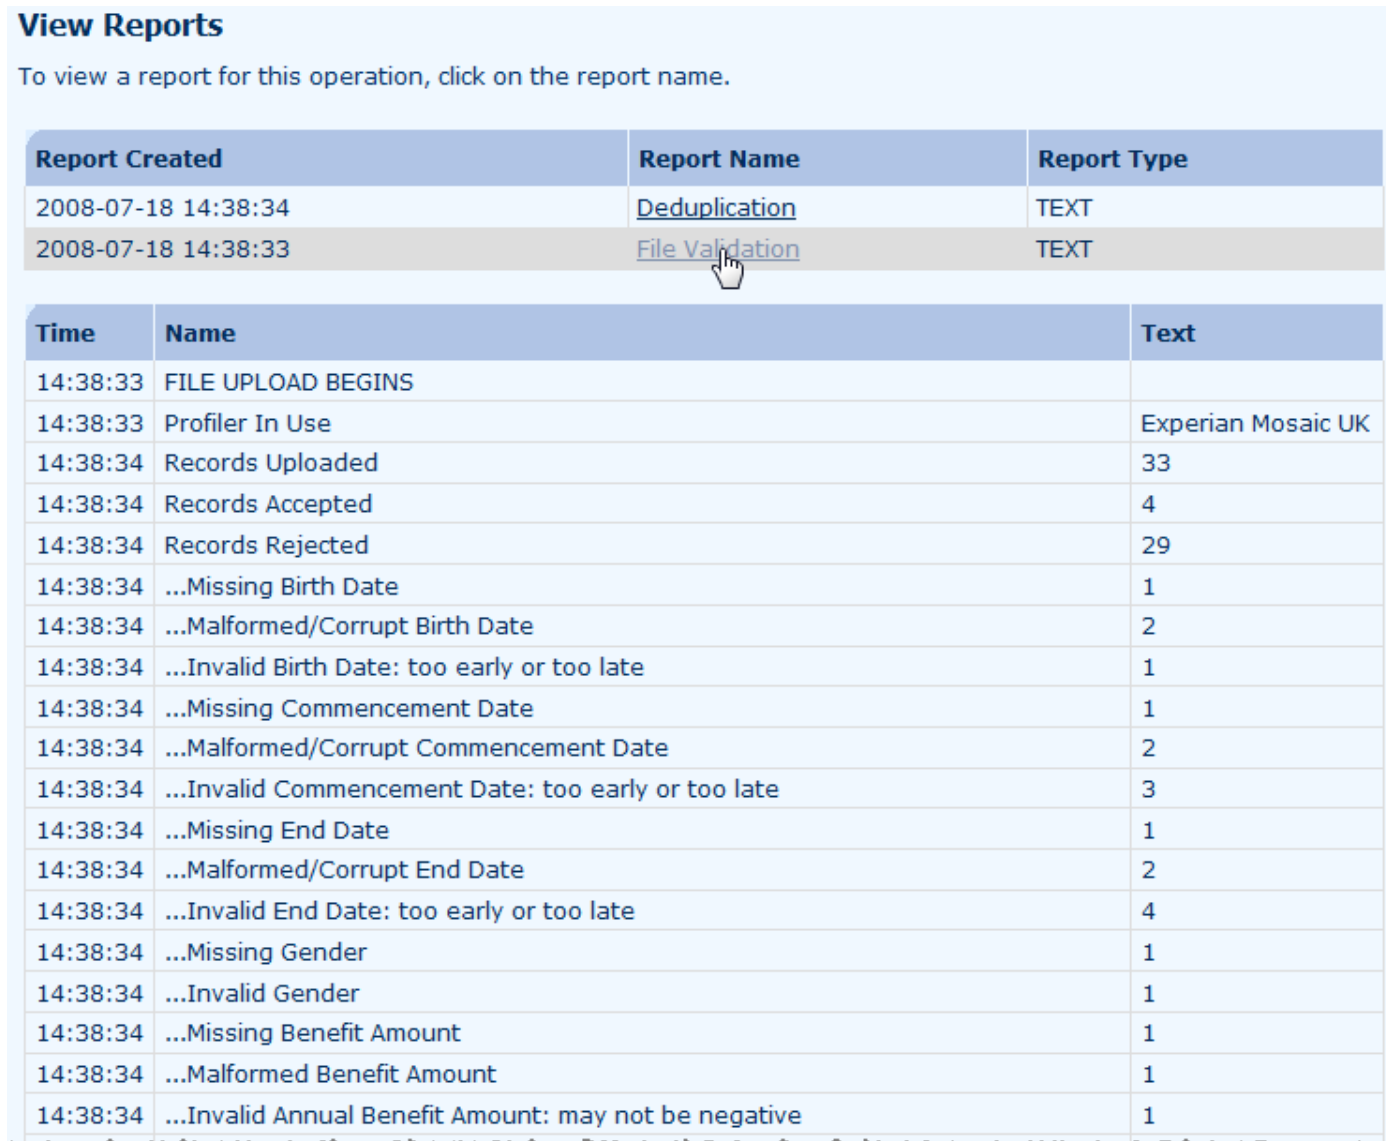
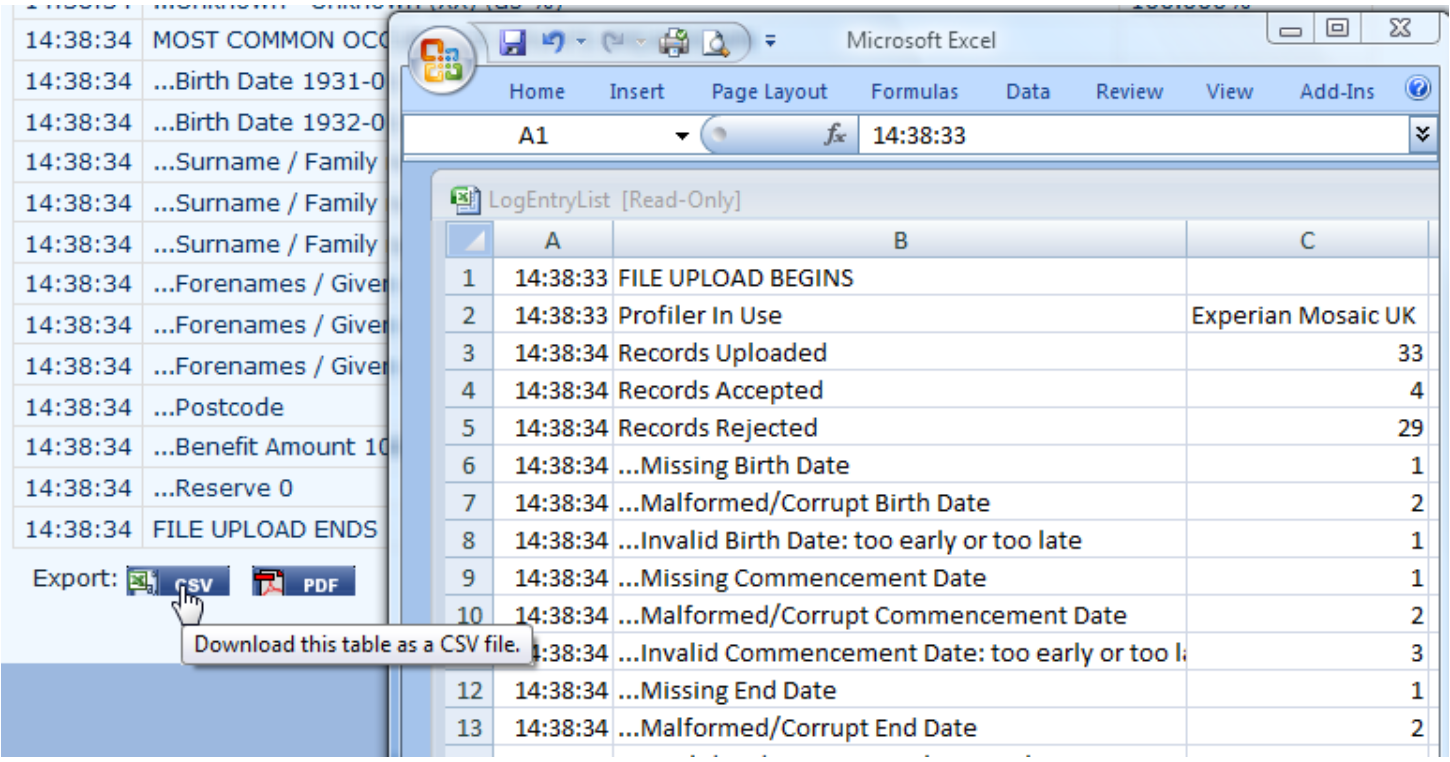
6.2 Throughout Longevitas, the information displayed in your browser can be downloaded in alternative formats for working with offline, including PDF and CSV files for loading into Microsoft Excel:
7. Deduplication
7.1 Deduplication is the process of identifying unique lives behind all the policies. This is essential for any kind of statistical modelling; without it, the crucial assumption of independence is violated and the model results will be unreliable. Most modelling packages implicitly assume your data is already processed and deduplicated, whereas Longevitas is an integrated package for easy data preparation.
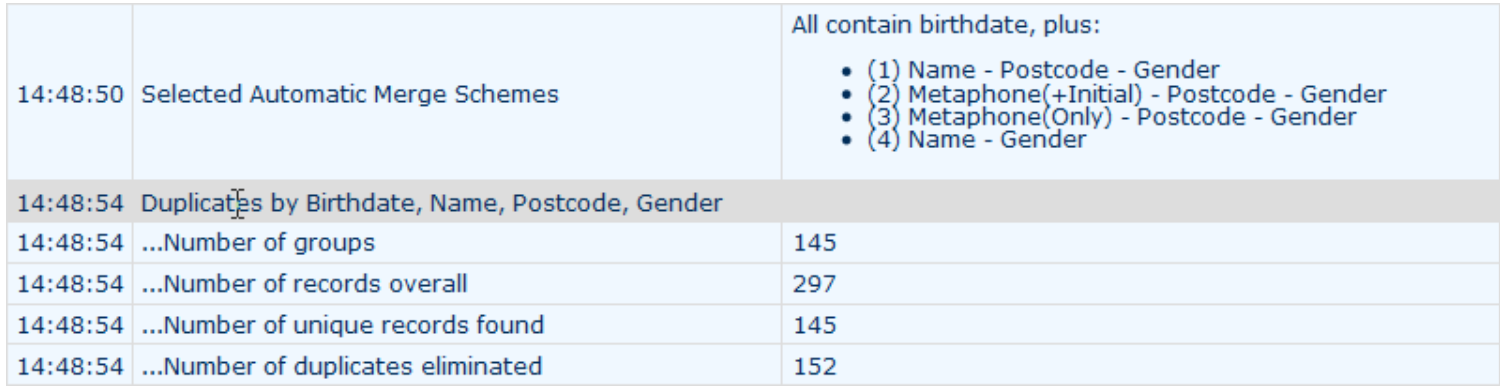
7.2 In the example below, the most stringent identifying 'key' of date of birth, name, postcode and gender has found 96,331 benefit records to people already receiving a benefit in the portfolio. These benefit records are then merged to create a database of 64,336 lives for statistical modelling from the 160,667 benefit records. This deduplication is essential for analysing life-insurance data as the people who are most likely to have multiple policies are also the people with the larger policies who live longer than average. Failure to deduplicate will lead to wrong, skewed results with financial consequences.
7.3 Longevitas offers a wide variety of deduplication keys, so you can tailor deduplication to the data you have. Option 10 (ClientId) allows you to use any single field you feel is reliable for deduplication.
7.4 A client's name is clearly an important part of many of the deduplication keys. The best structure is separate surname and forename fields, but Longevitas can also handle single-field names of varying order:

7.5 When matching names, Longevitas uses an algorithm called double metaphone to catch common mis-spellings of the same name. The original metaphone algorithm was for surnames of an Anglo-Saxon origin, whereas double metaphone extends it to non-Anglo-Saxon surnames. This means that Longevitas can correctly identify the same underlying person, even where they have been entered onto an administration system twice with different client ids (this is very common):

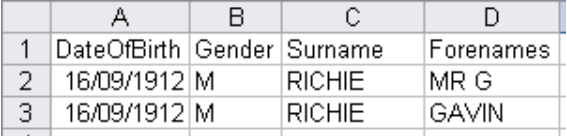
7.6 When looking to compare the first initial of the forename, a major complication can be the inconsistent inclusion of the person's title. Longevitas recognises titles and knows to skip them when matching names, so the following two names will be matched despite the inclusion of a title in one of them:
7.7 Longevitas has a built-in list of titles, which will be automatically stripped from the name field unless you tick the box to have them kept:

7.8 The built-in list is based on titles we have come across during our work in the UK (yes, including the Comtesse!). If there are titles in your name fields which are not listed, you can add them easily:

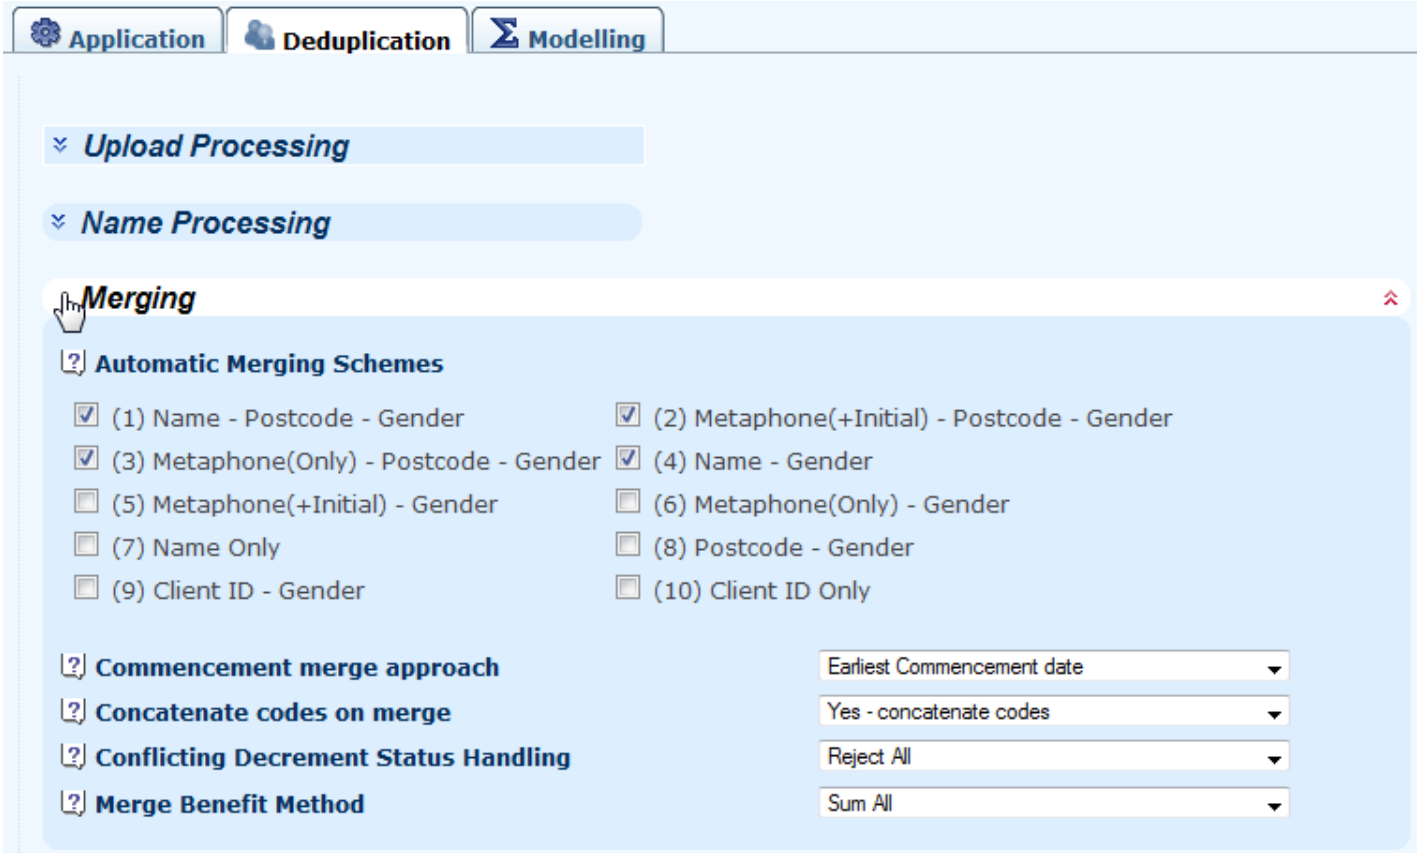
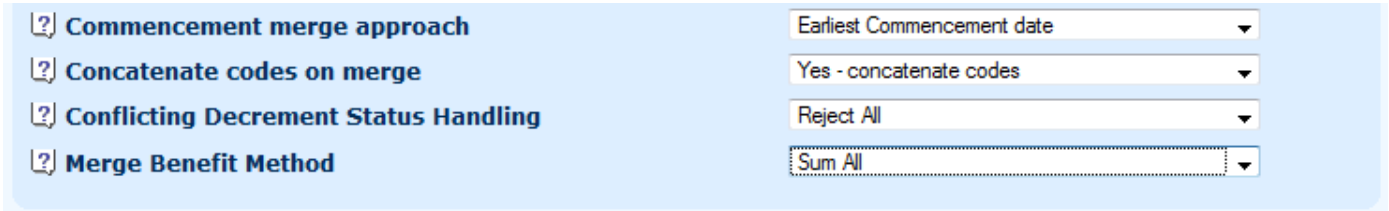
7.9 When merging two or more benefit records, some decisions have to be made about which record will the primary record, how codes will be handled, how conflicting decrements are dealt with, and how benefits are merged. These behaviours all default sensibly, but may be changedas the need arises:
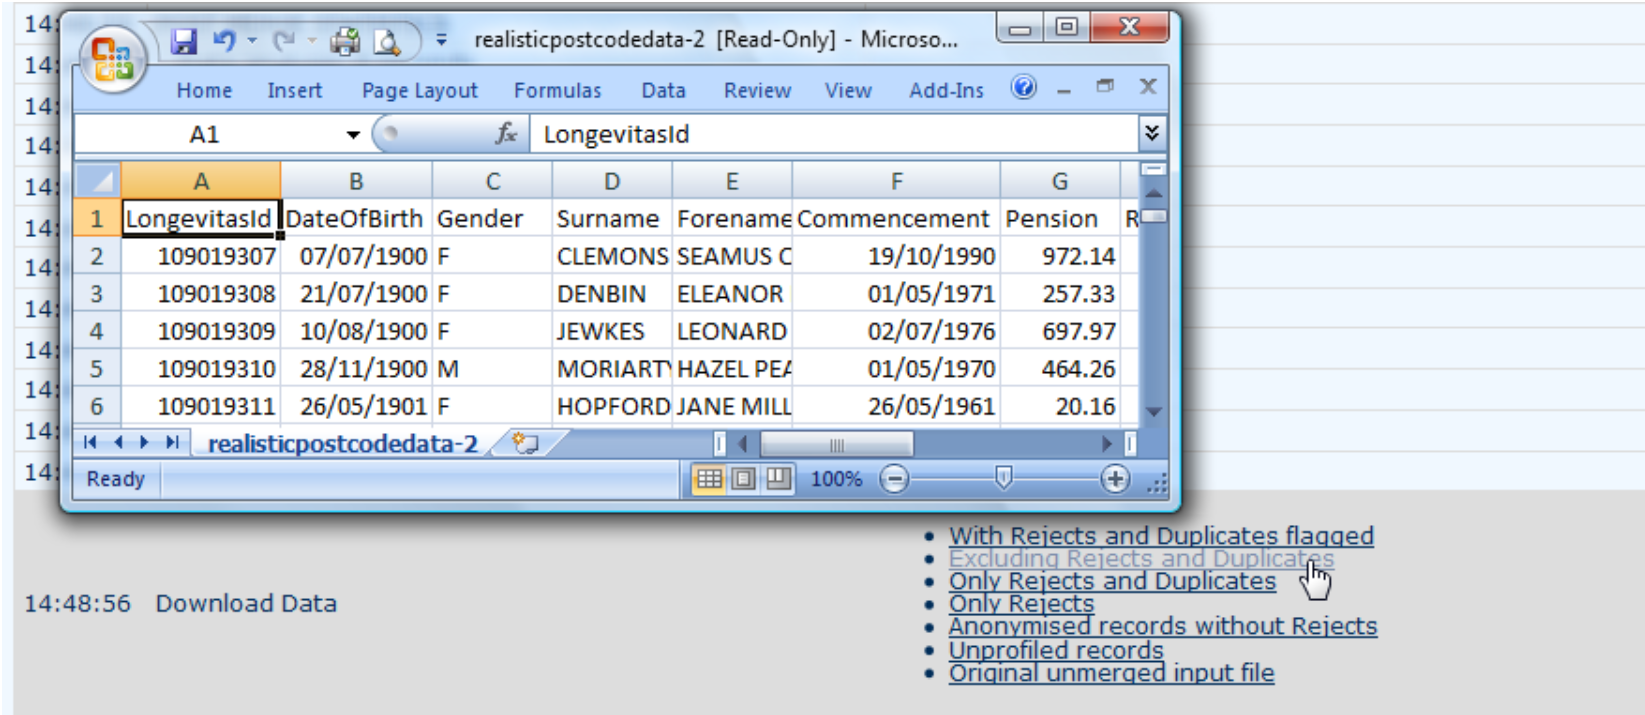
7.10 Finally, after deduplication you have the option of downloading the validated and deduplicated data, for example for use in another modelling systems. Alternatively, you can download the original file with the validation errors appended so you can pass it back to a data clean-up team:
8. Profiling
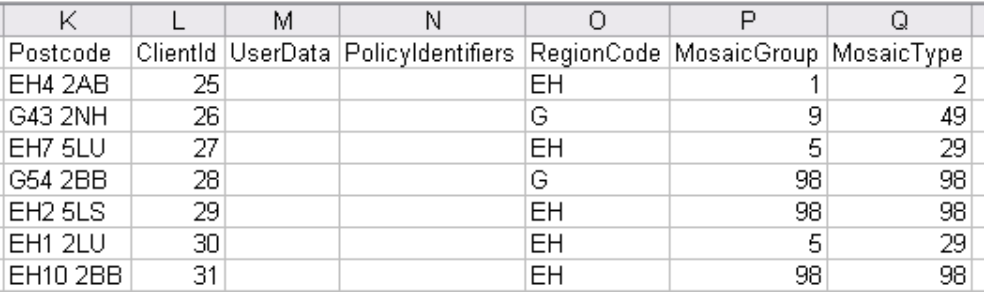
8.1 During the deduplication stage, the lives are profiled for their socio-economic group and their region. This is done via the postcode (UK and Netherlands versions) or else the postal code (Canadian version) or zip code (United States version). In the example below, the UK postcode has been used to extract both the region (EH for Edinburgh, G for Glasgow) and the Mosaic Group and Type. Where a postcode is not recognised by the socio-economic profiler (code 98 for Mosaic Type), the region could still be extracted and used.
8.2 Longevitas is currently set up with an automatic profiler for the UK and the Netherlands (via postcode), Canada (via postal code) and the United States (via the nine-digit zip code). Profiling for other territories can be added on request.
9. About the models
9.1 They key thing about all Longevitas models is that they handle mortality at the level of the individual, not the summarised group. This is crucial, as it allows the use of an unlimited number of risk factors in the modelling, and it means never having to worry about having enough experience data for certain rare combinations of risk factors. For a detailed discussion of why modelling is best at the level of the individual, see our article in Life and Pensions magazine.
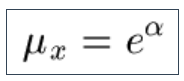
9.2 The simplest model is the Cox model for the force of mortality:
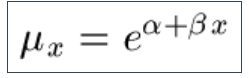
9.3 A much more useful model is the Gompertz Law for the force of mortality, and we find this works particularly well for modelling pensioner longevity up to age 95:
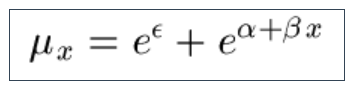
9.4 An occasionally useful alternative to the Gompertz Law for the force of mortality is the extension by Makeham to include a constant minimum force of mortality:
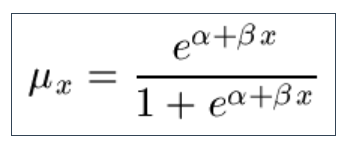
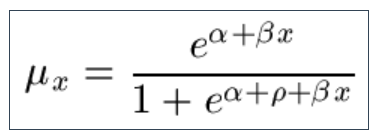
9.5 A particularly useful alternative to the Gompertz Law for the force of mortality is to use a logistic form, often attributed to Perks:
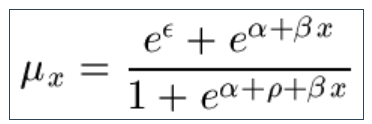
9.6 Another useful model for the force of mortality in later life is to include allowance for heterogeneity in the Perks Law, which gives a model attributed to Beard:
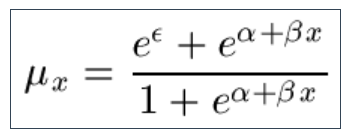
9.7 Yet another model is the Makeham-Beard Law, which arises formally from heterogeneity in the intercept in Makeham's Law:
9.8 The Makeham-Perks Law is similar, but with the Beard heterogeneity parameter set to zero:
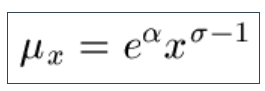
9.9 Another alternative is the Weibull law, which arises from failure processes for machines:
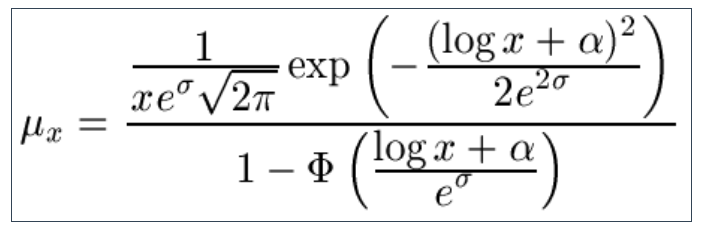
9.10 Another option is to assume that the lifetime is distributed lognormally, which leads to the somewhat fearsome definition of the force of mortality (Φ() is the standard normal cumulative distribution function):
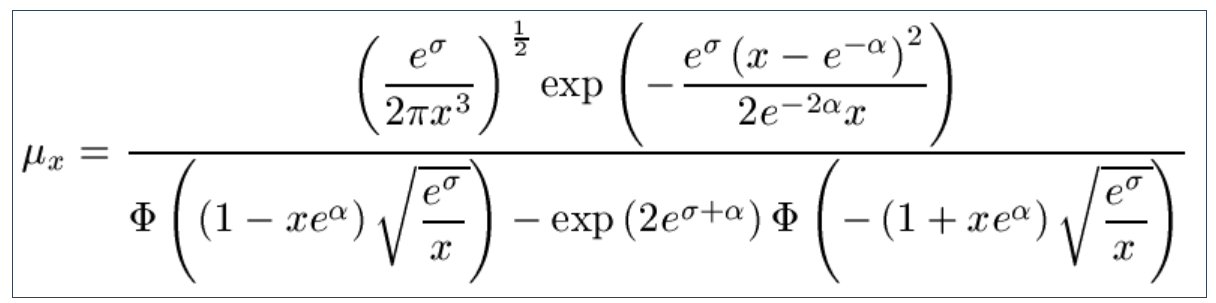
9.11 If you thought the Lognormal definition was alarming, look away now while the Inverse Gaussian law is defined (Φ() is the standard normal cumulative distribution function):
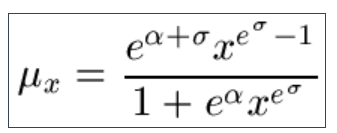
9.12 There is also the Log-Logistic law :
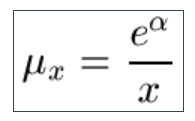
9.13 And also the Pareto law :
9.14 A further option the Kannisto law, which merges the Makeham and Perks laws:
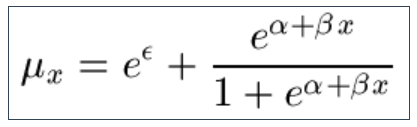
9.15 All of the above are survival models, and they typically make the best use of the available data. However, some practitioners may wish to use their existing generalised linear models (GLMs) as a sense check on the survival-model output. Longevitas offers a variety of GLMs for backward compatibility, including the most commonly used logistic regression (simplified Perk's Law for mortality). Until 2006 we used this model extensively in our consulting work until it was superceded by survival models:
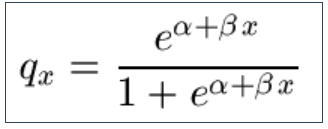
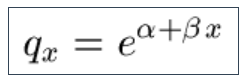
9.16 Other GLMs are also available, including the Gompertz Law for the rate of mortality:
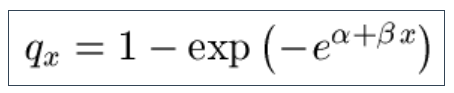
9.17 and others including the Extreme-Value Law for the rate of mortality:
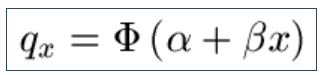
9.18 The Probit-Gompertz Law for the rate of mortality (Φ() is the standard normal cumulative distribution function):
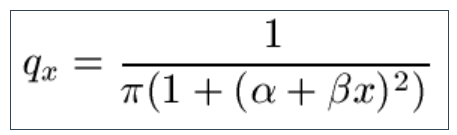
9.19 Longevitas also offers the Cauchy Law for the rate of mortality:
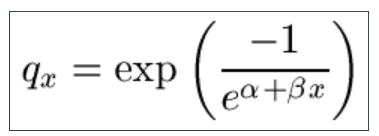
9.20 Little-used, the Reverse Extreme-Value Law for the rate of mortality is also offered for completeness:
9.21 Longevitas correctly fits GLMs over multiple years' data on an individual basis, and only Longevitas has GLMs in conjunction with the factor optimizer (see later).
10. Fitting a model
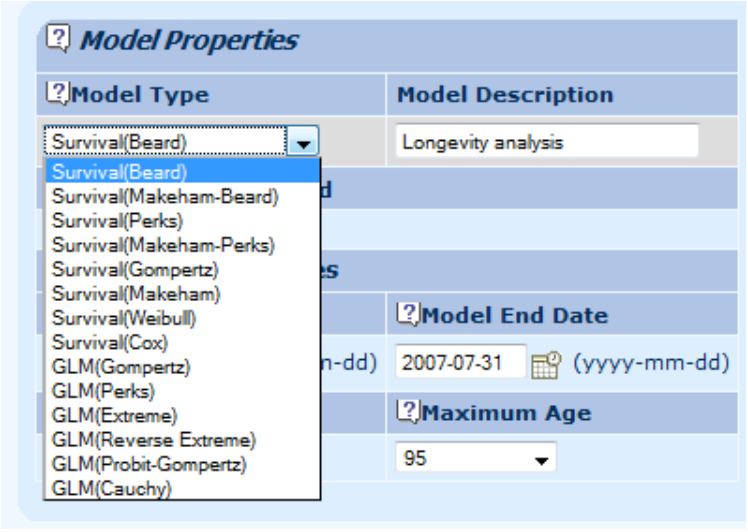
10.1 Longevitas comes with a wide variety of model types which can be fitted. The most useful choice for pensioners receiving their benefits is usually a Perks, Beard or Makeham-Beard survival model. However, for users migrating from generalised linear models (GLMs), Longevitas also offers a selection of the most common older qx models. One thing of particular interest to GLM users is Longevitas's unique ability to model mortality over multiple years within the same qx framework.
10.2 In addition to fitting a model, Longevitas can generate the equivalent tables of qx for easy input into your actuarial calculations.
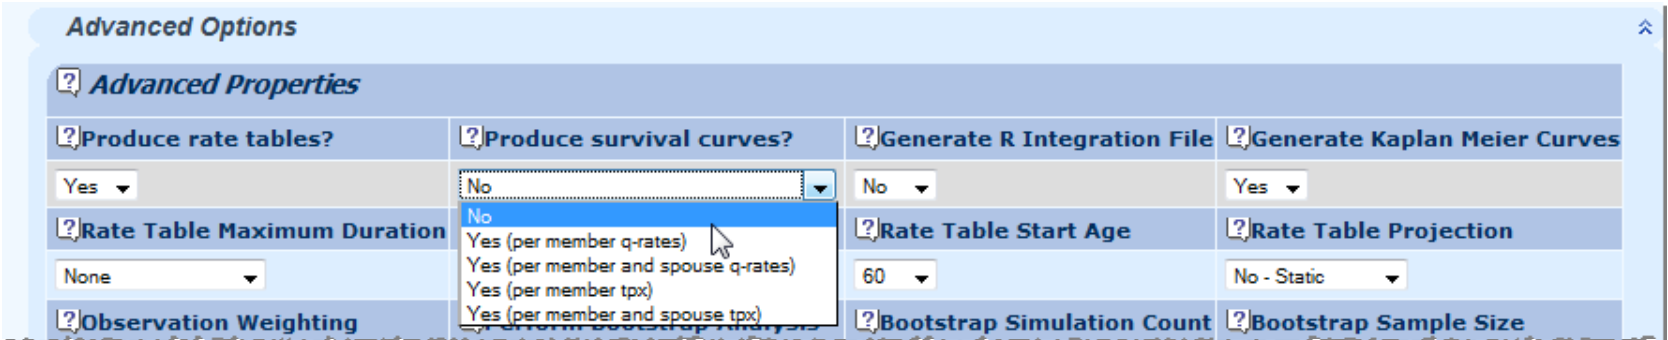
10.3 In addition, Longevitas can also generate highly specific life tables for each life in the portfolio, either as qx or tpx.
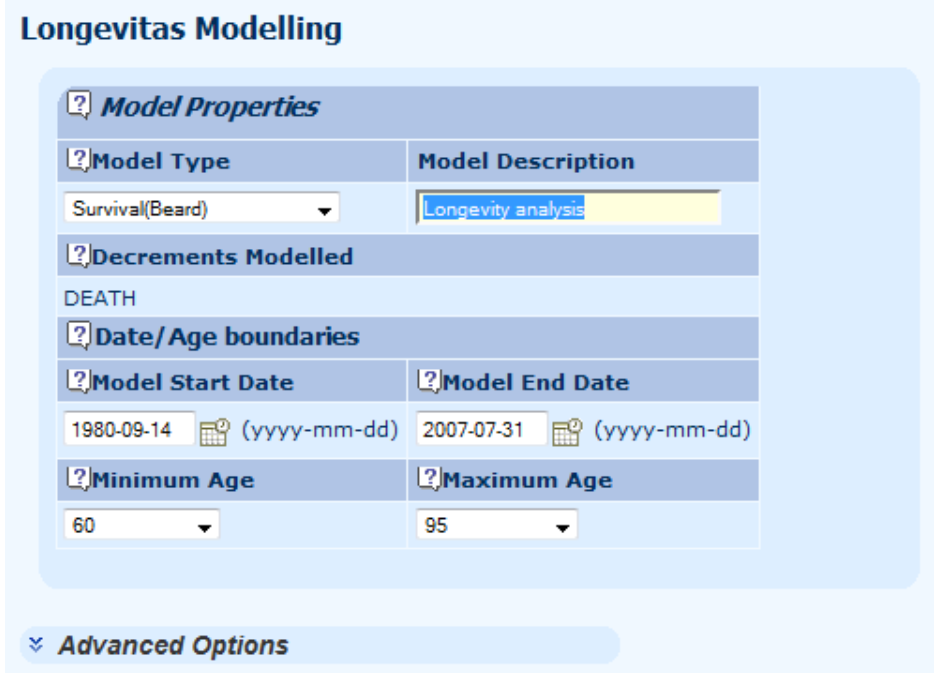
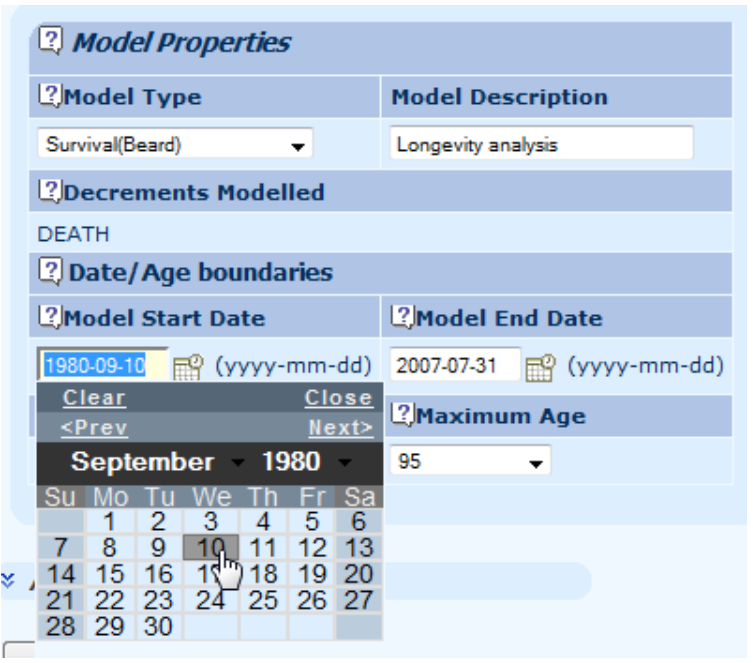
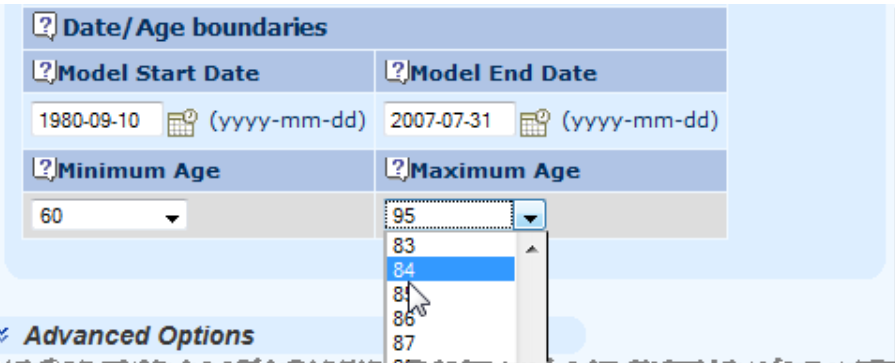
10.4 Longevitas allows you to model between a range of dates, or a range of ages, or both. If you only want to model data in the recent past, for example, you can specify the date from which to start modelling. Equally, if you don't want to model beyond a particular date, say because of worries about late-reporting of deaths, you can specify an upper bound as well.
10.5 Certain processes behave differently over different age ranges: for example, mortality before age 60 is a different process from mortality after age 60. Longevitas allows you to specify which age range you want to model:
10.6 Specifying the model is very simple.
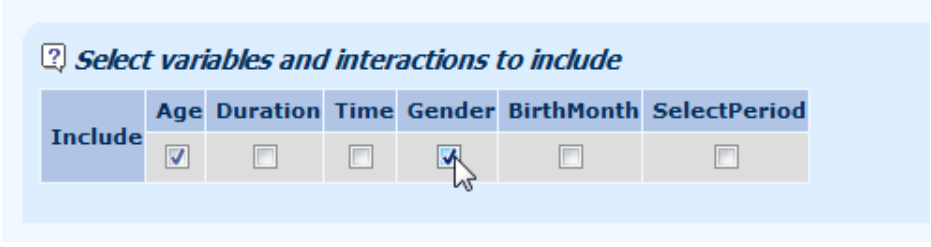
10.7 Specifying variables to include in the model is a simple matter of ticking the boxes:
11. Factor optimisation
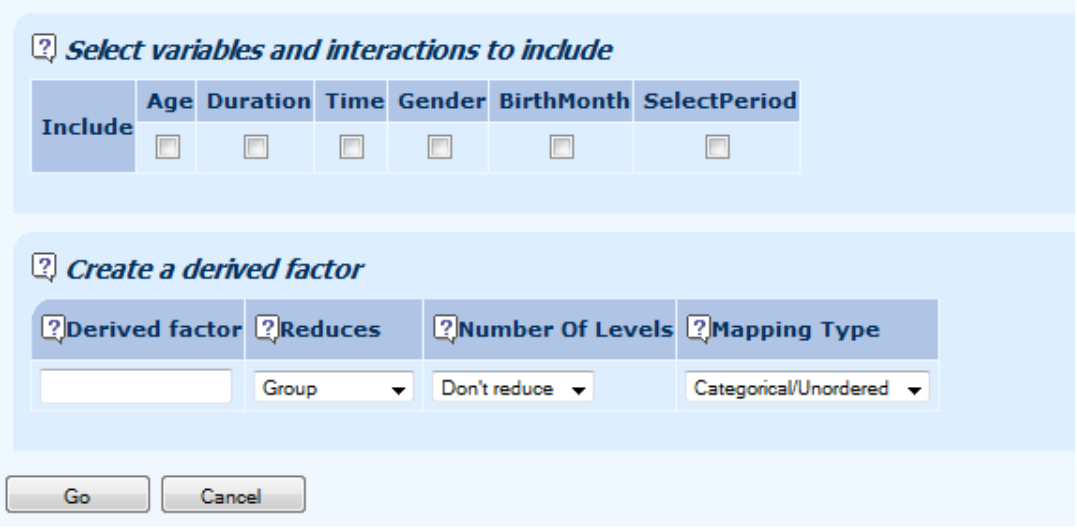
11.1 For highly complicated factors with many levels, such as socio-economic group or region, it is possible to have an optimised simpler factor derived from the complicated one. In the example below, instead of using the 61-level Mosaic Type classification, we are asking Longevitas to find the optimal definition of a simpler four-level category based on this.
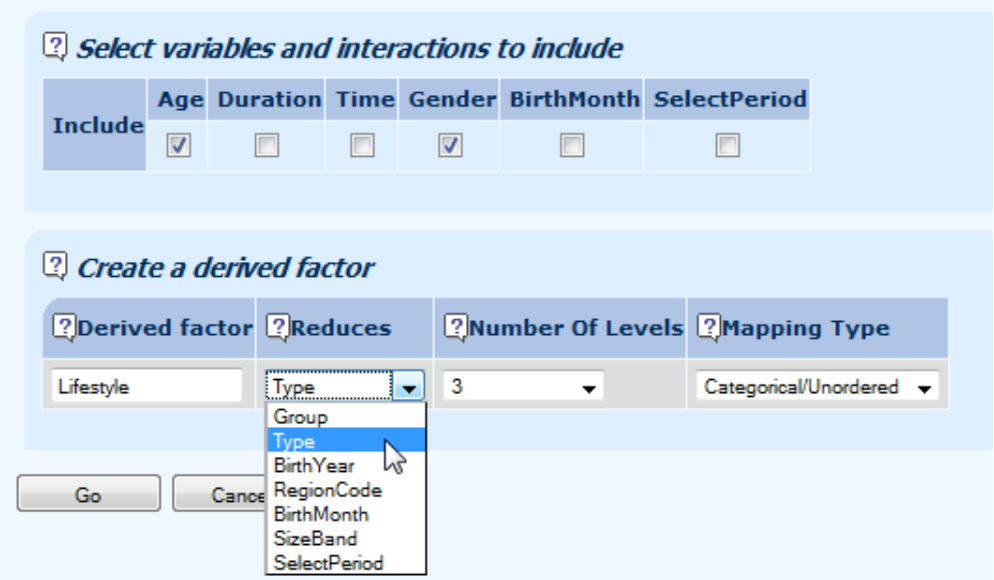
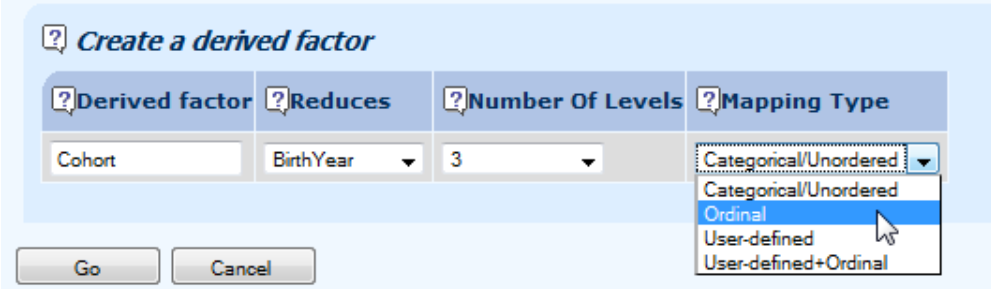
11.2 This so-called factor optimisation can be applied to any variable which takes a large number of values and where simplification is necessary: creating a region factor from the region codes, for example, or product class from hundred of product codes. For complicated factors where the levels have a natural structure or order, it is possible to have this order respected during the optimisation by asking for the factor to be ordinal. In the example below, we are asking Longevitas to create the optimal four-level cohort factor, but insisting on contiguous ranges of years of birth:
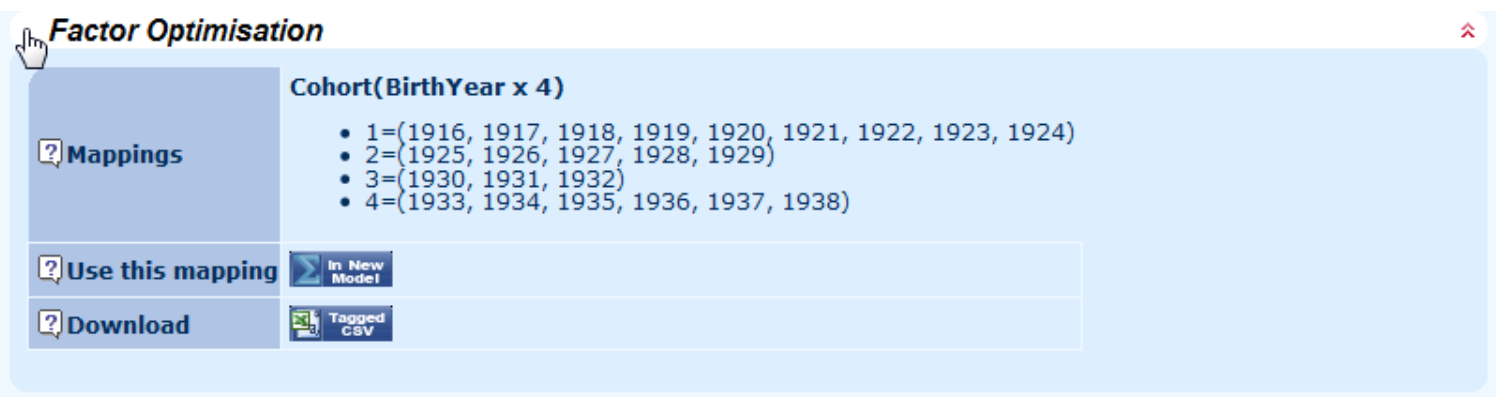
11.3 When optimising a new factor Longevitas fits every possible combination, which can mean fitting thousands of different models. At the end, you will be sent an email telling you to log back in and pick up the results. Longevitas will not only give you the fitted model, but also the definition of the new optimal factor:
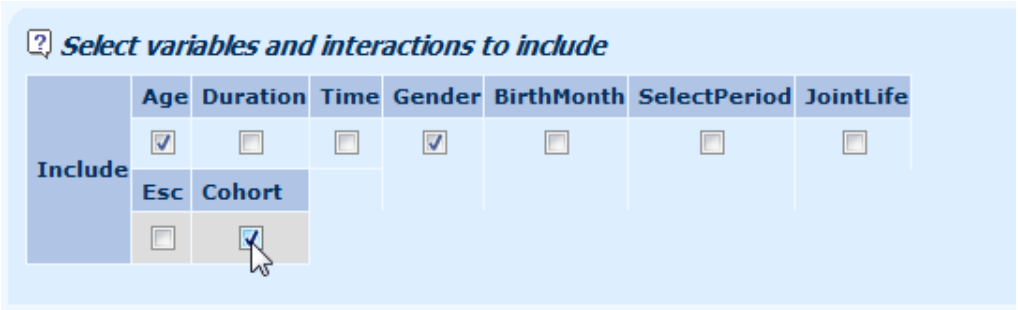
11.4 You can repeatedly build upon these optimal factors: the link 'use in a new model' enables you to build a new model, this time with your newly optimised factor as an available option. The screenshot below shows how the newly created optimal factor 'Cohort' is now available for further modelling:
12. Model results
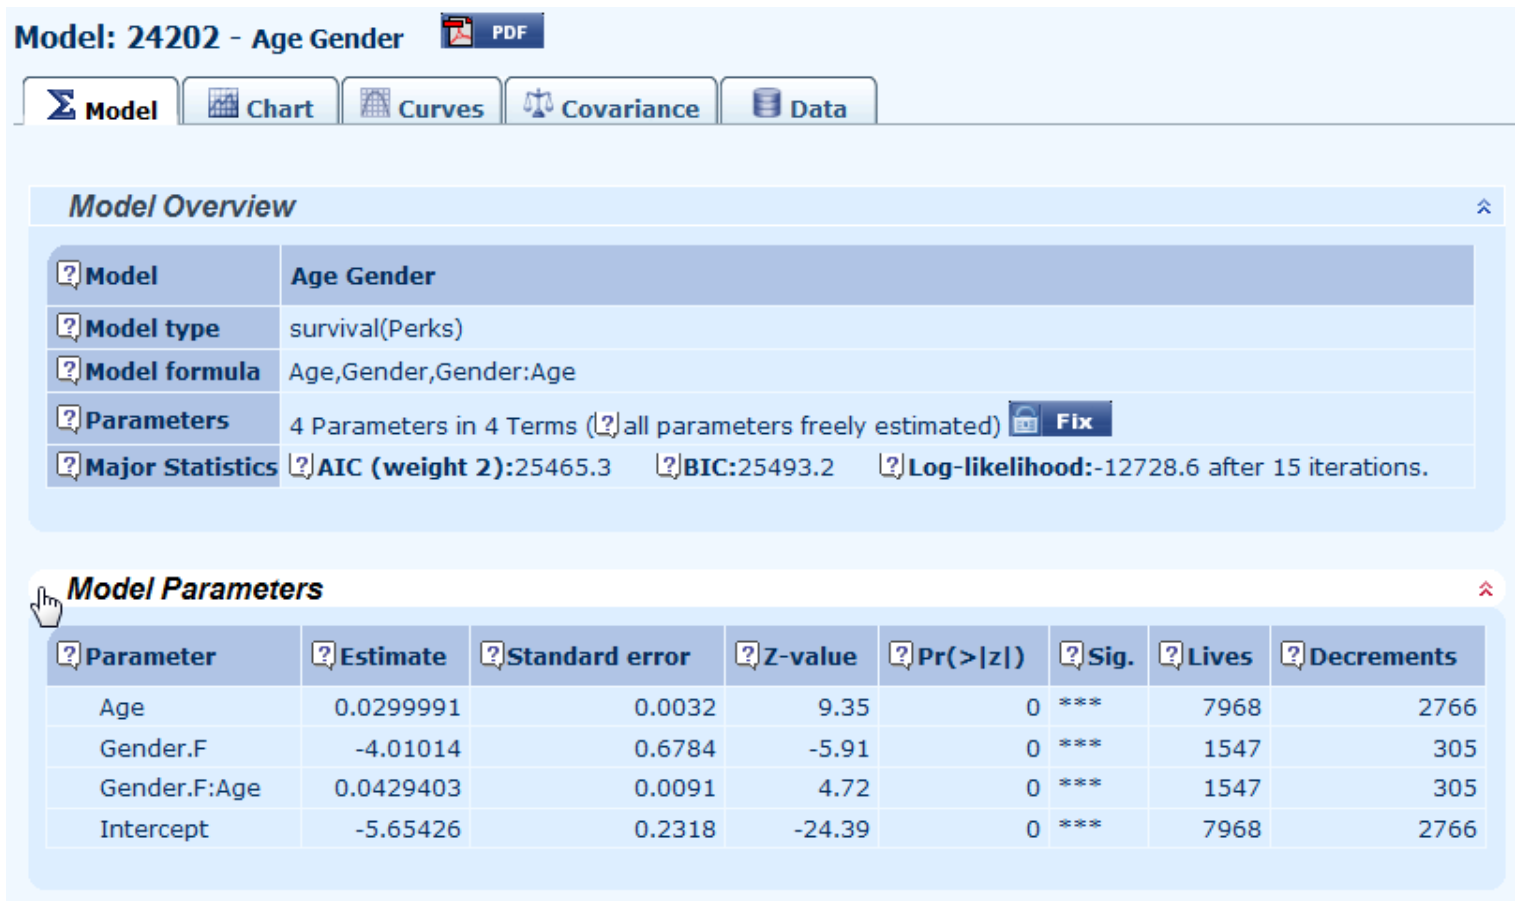
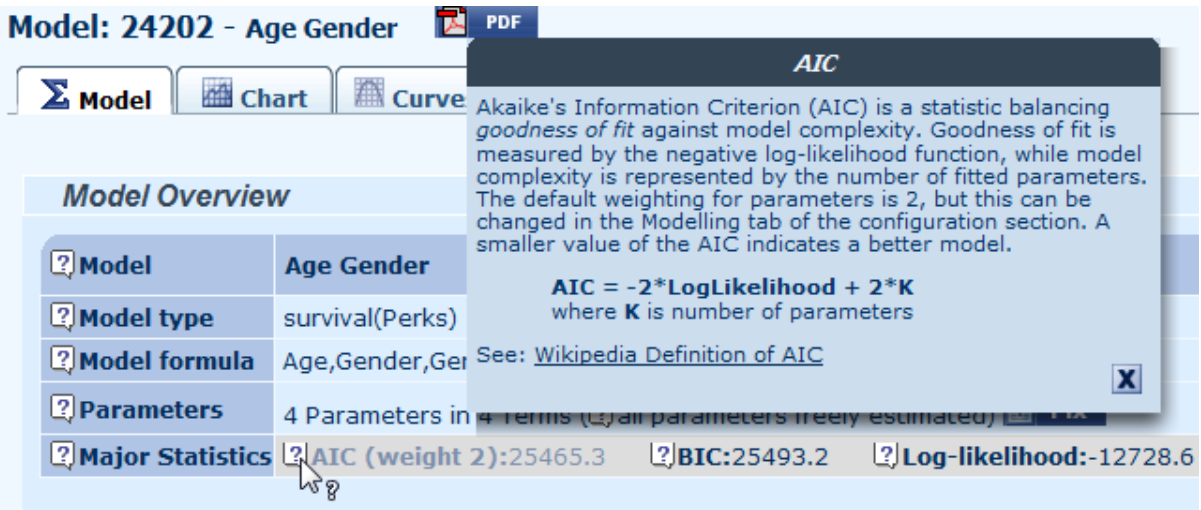
12.1 Longevitas is a statistical package, and each model comes with important output regarding the fitted values and the statistical significance of them. In the example below, a simple model for age and gender differentials is fitted, with all parameters highly significant:
12.2 Where you see the question-mark icon there is online help available. Simply mouse click the question mark to see the help text, as in this example for the AIC:
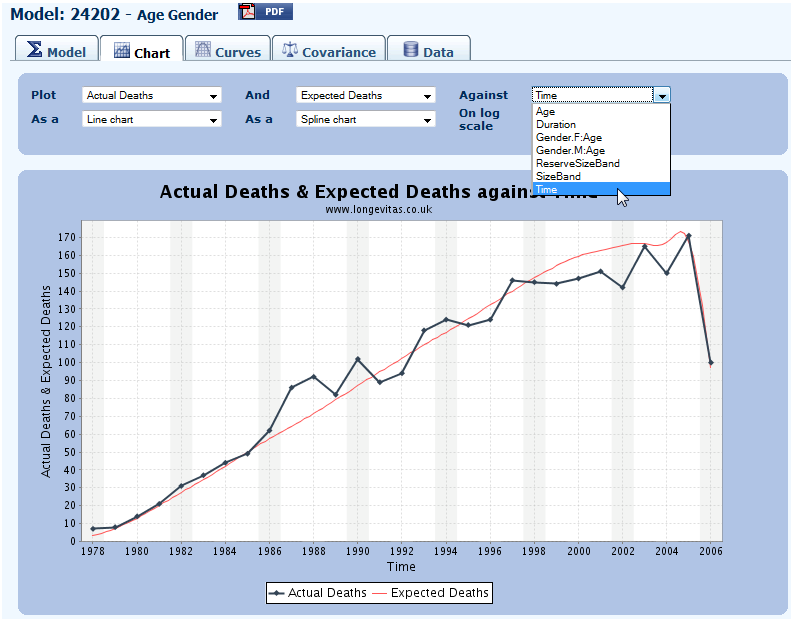
12.3 You can create graphs to explore the data and the model fit, including plotting residuals, number of lives, actual v. expected and many other measures:
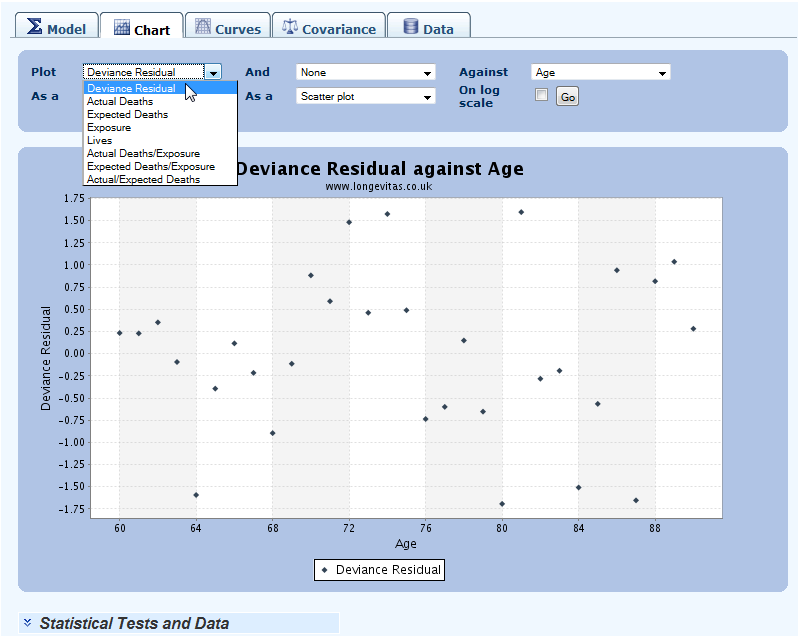
12.4 Plotting can be against age, duration, time, and can also be limited to sub-groups:
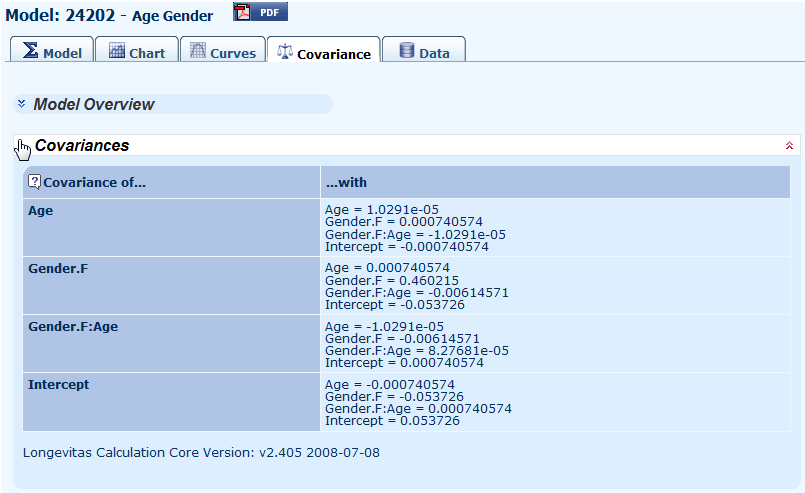
12.5 For those interested in the dependencies between parameters, say for exploring alternative model fits or for creating coherent stress tests, Longevitas will give you the covariance matrix for the parameter estimates:
13. Using Longevitas's output in your business
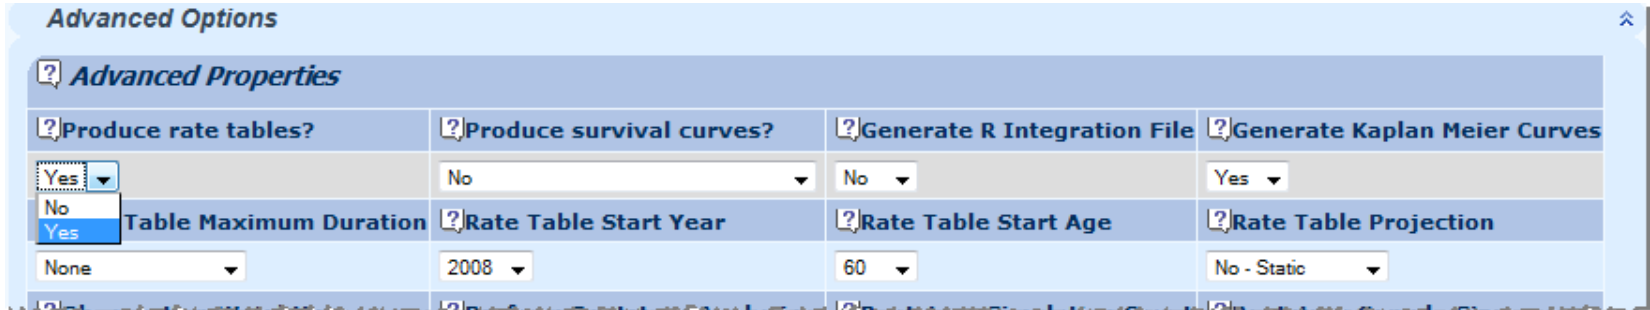
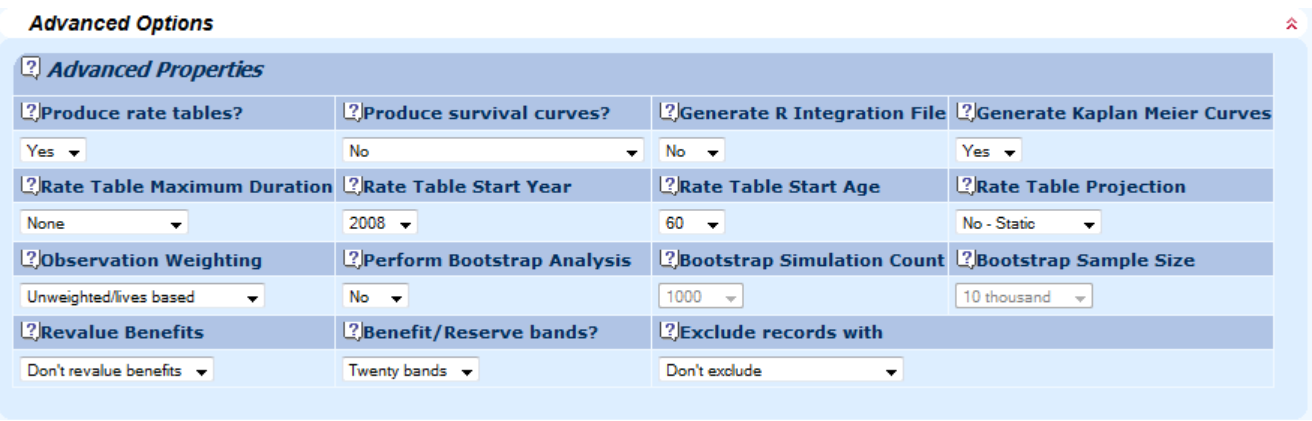
13.1 When you have decided on the risk factors you want to use, you can generate rate tables for use in your actuarial calculations. Simply select this option prior to fitting the final model:
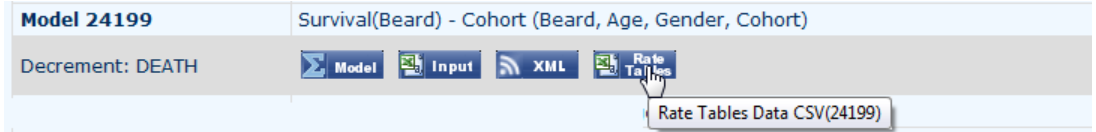
13.2 When the model is fitted, from the file history screen you will see that you have some rate tables you can download:
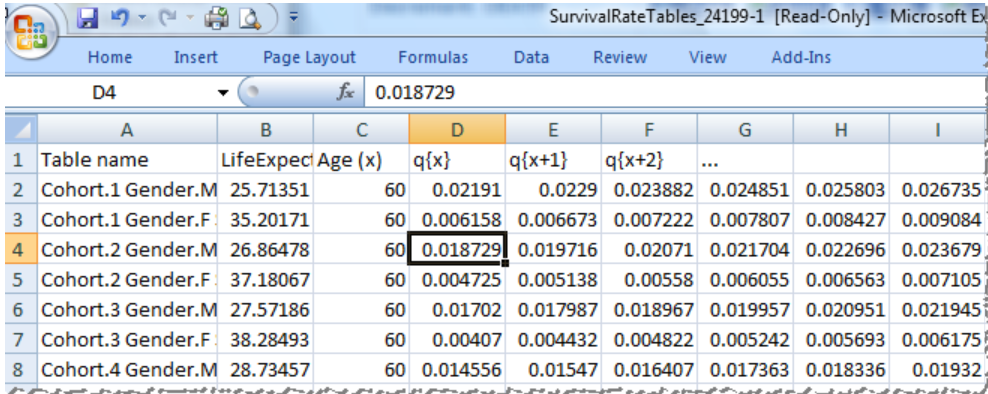
13.3 Rate tables are in a simple CSV format for easy uploading into other applications, including Microsoft Excel:
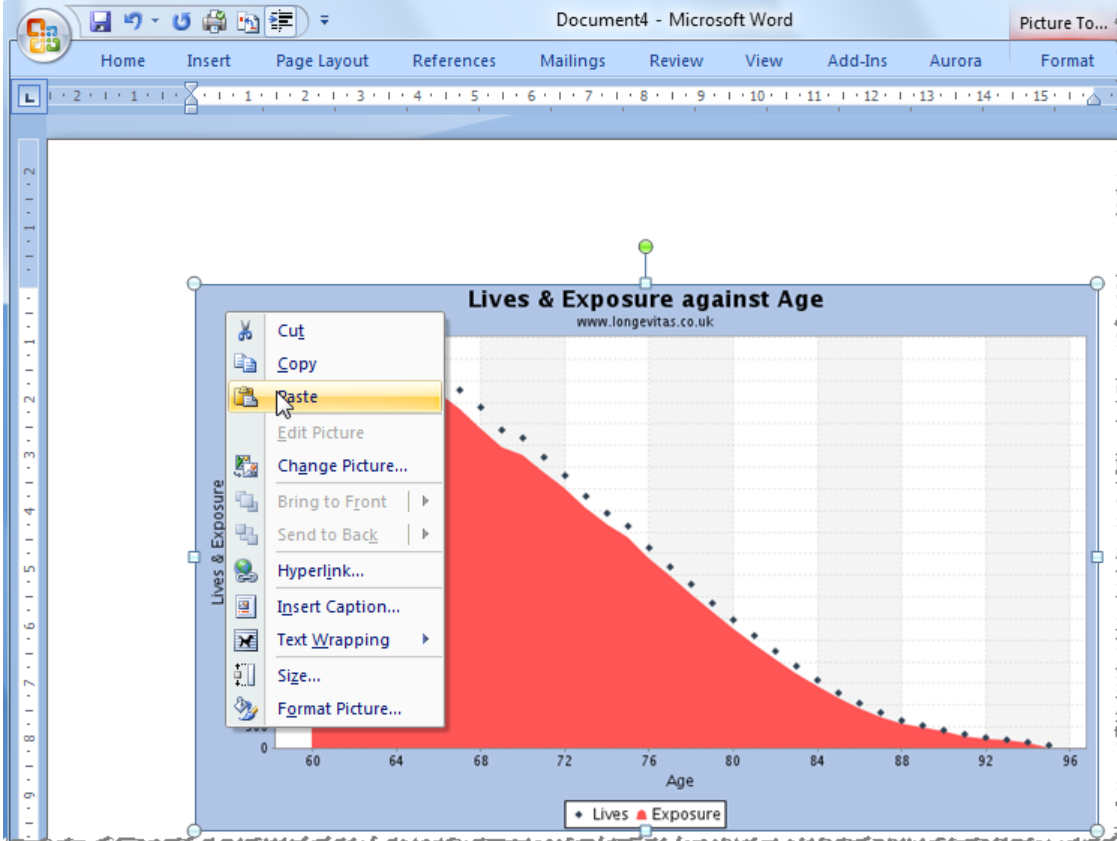
13.4 You can copy any graphs in Longevitas:
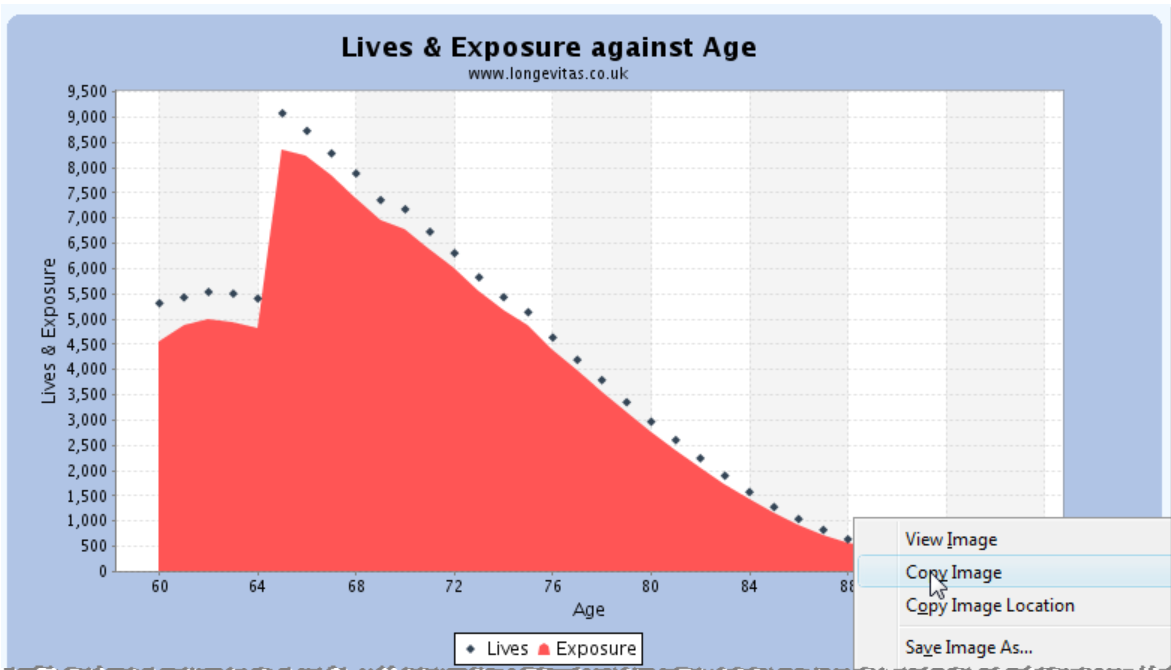
13.5 ...and paste them into other reports, including Microsoft Word:
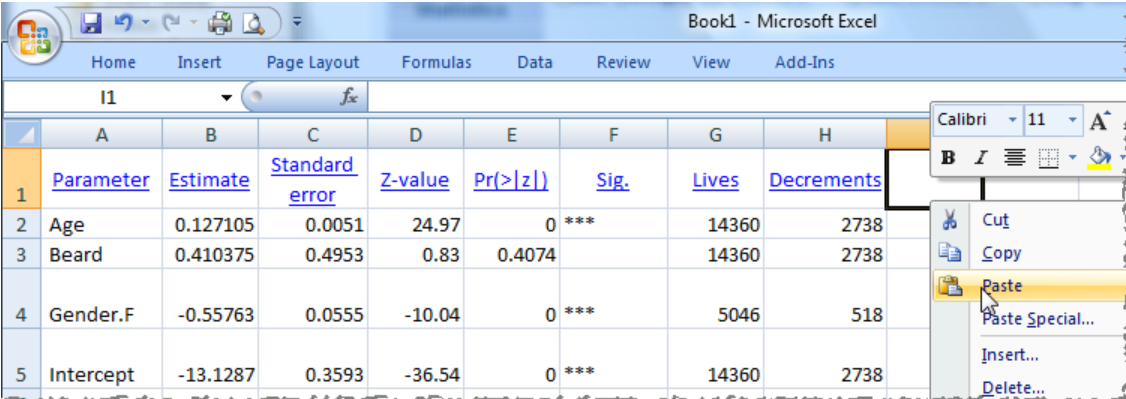
13.6 You can also copy tables...
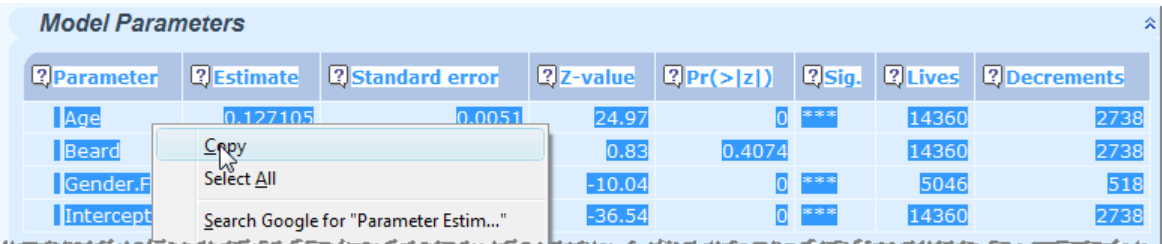
13.7 ...and paste them into another application, such as Microsoft Excel:
14. Transparency
14.1 It is important that any system is not a "black box". One way of demonstrating that Longevitas produces the correct results is to test its output against that of other systems. This sections demonstrates a comparison between a version of Longevitas and The R Statistical Computing Platform for both GLMs and survival models.
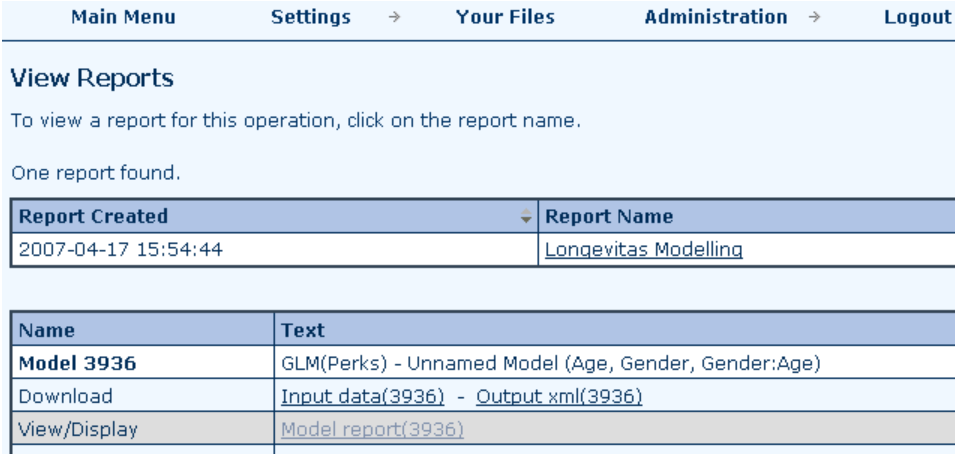
14.2 Longevitas is a deliberately open system with respect to its modelling. Each model report is accompanied by both the input data and the output XML. The input data allows you to download the exact data input into Longevitas for use in other modelling systems. The output XML allows you to integrate Longevitas's output with your other systems.
14.3 Below is a screenshot of the model report list. In addition to the browsable report itself, you can see (a) the downloadable file of data actually fed into the calculation core, and (b) the report in XML format for input into other computer systems.
14.4 The ability to fit multi-year GLMs at an individual level is unique to Longevitas, so we will have to satisfy ourselves with back-testing a single-year GLM. Below is the Longevitas screenshot for a Perks model for the rate of mortality:
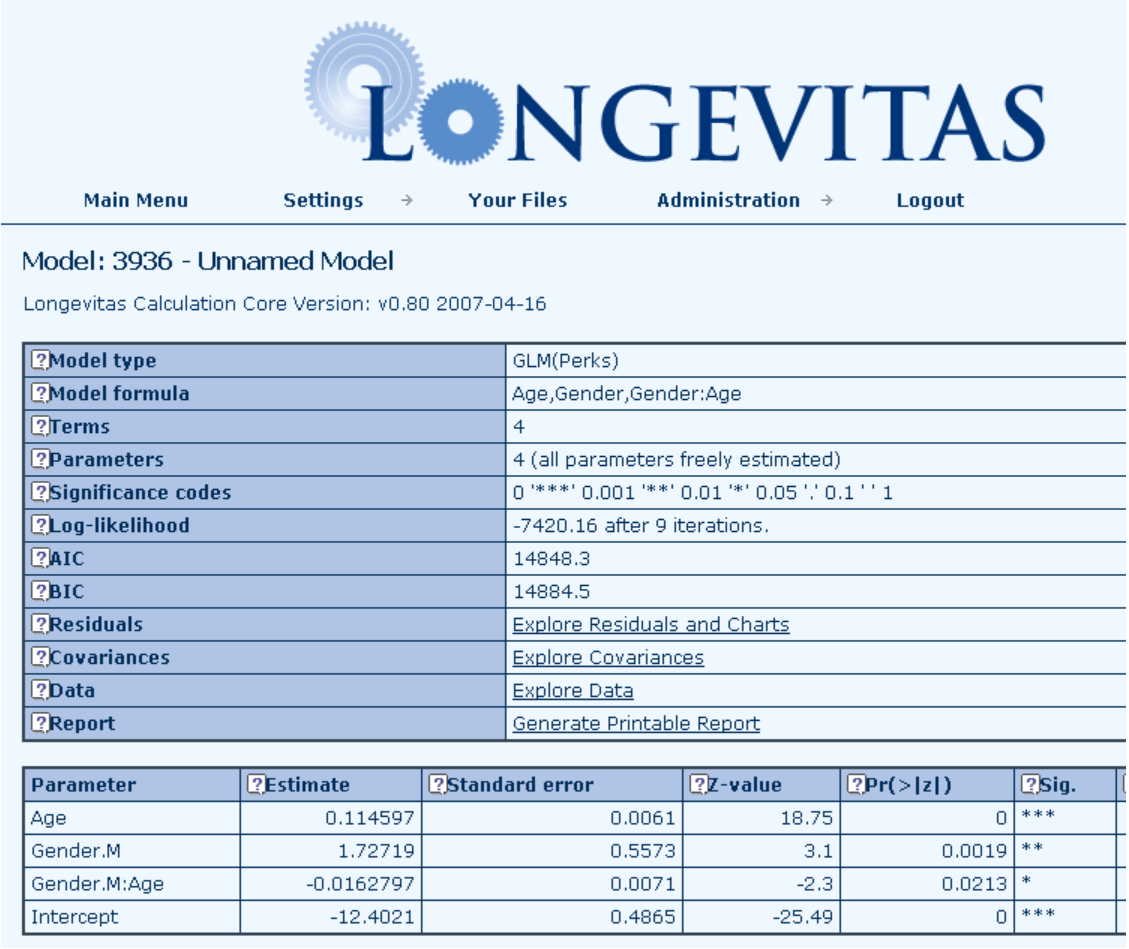
14.5 By downloading the input file, we can also read this self-same data set into R and check the results. Below is the R screenshot, which includes the necessary R commands to fit the equivalent model and the model output:
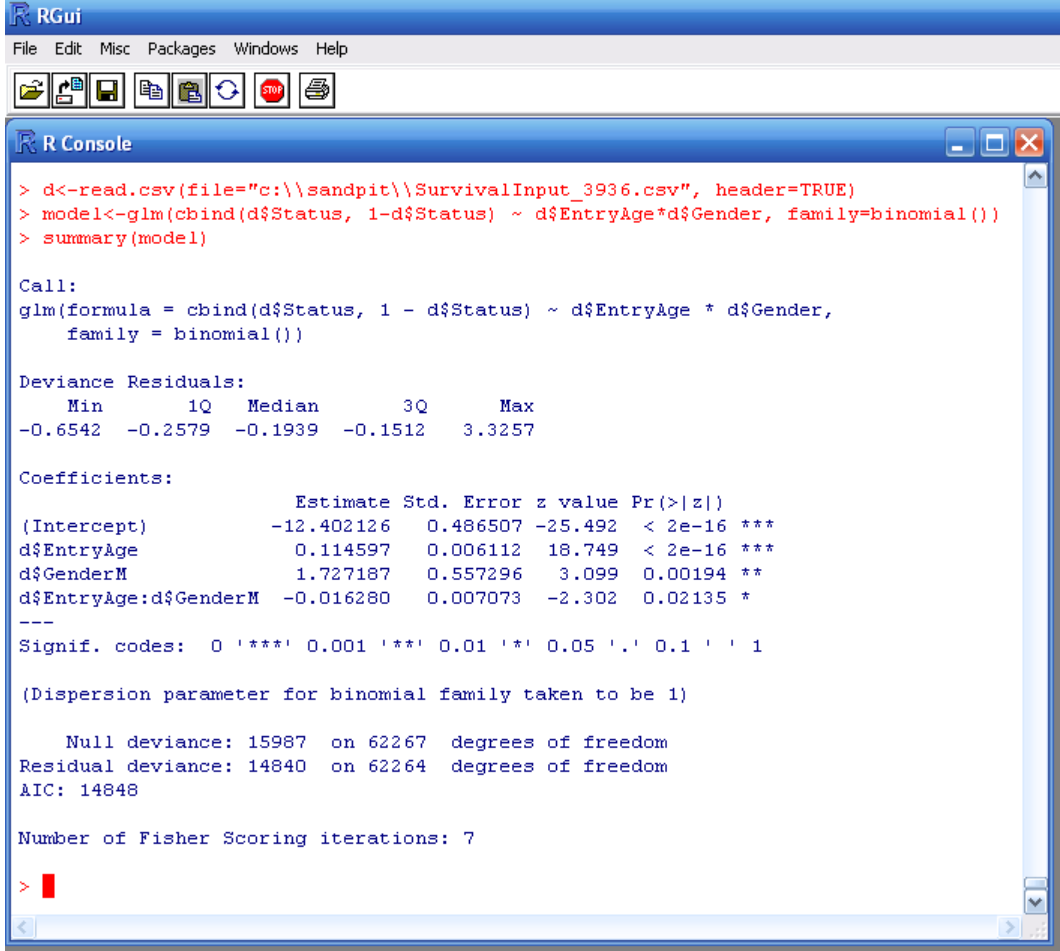
14.6 As can be seen, the estimates, standard errors and AIC are all the same in both systems.
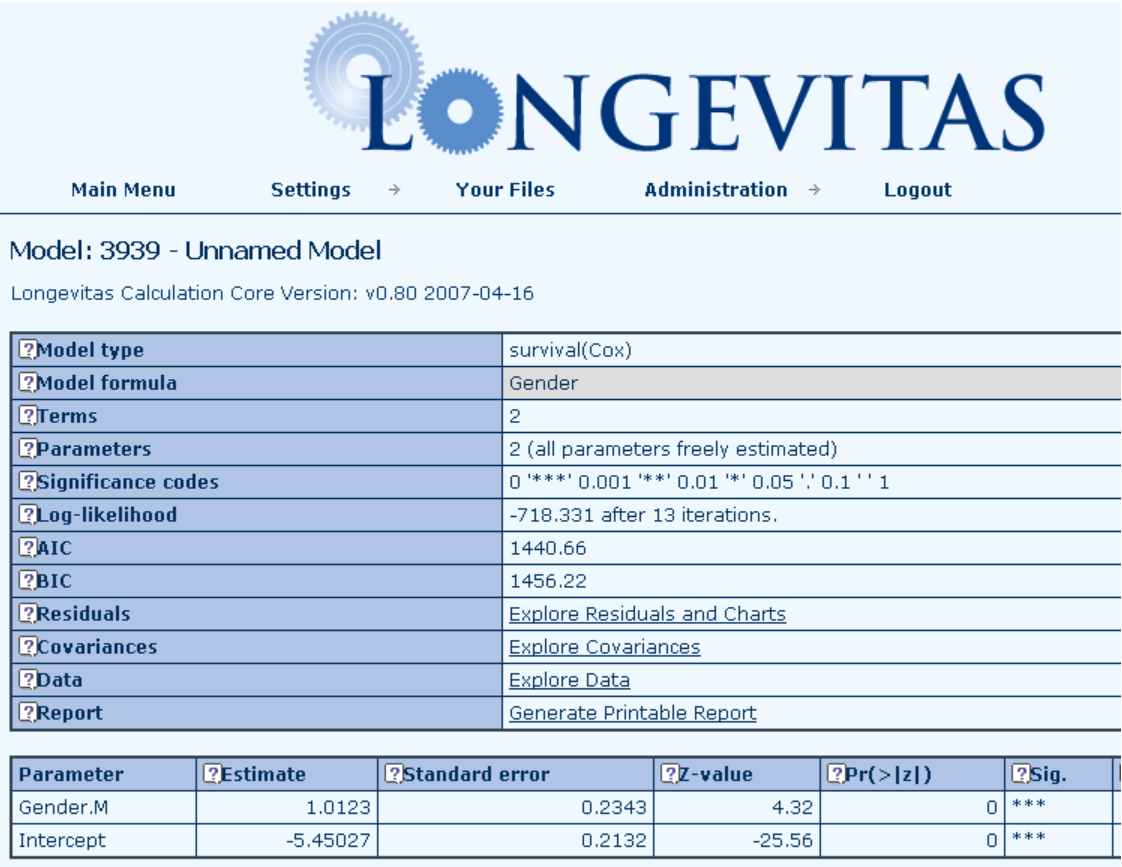
14.7 The ability to fit survival models with multiple varying coefficients of age, duration and time is unique to Longevitas, so we will have to back-test a simple Cox model. Below is the relevant Longevitas screenshot :
14.8 By downloading the input file, we can also read this self-same data set into R and check the results. Below is the R screenshot, which includes the necessary R commands to fit the equivalent model and the model output:
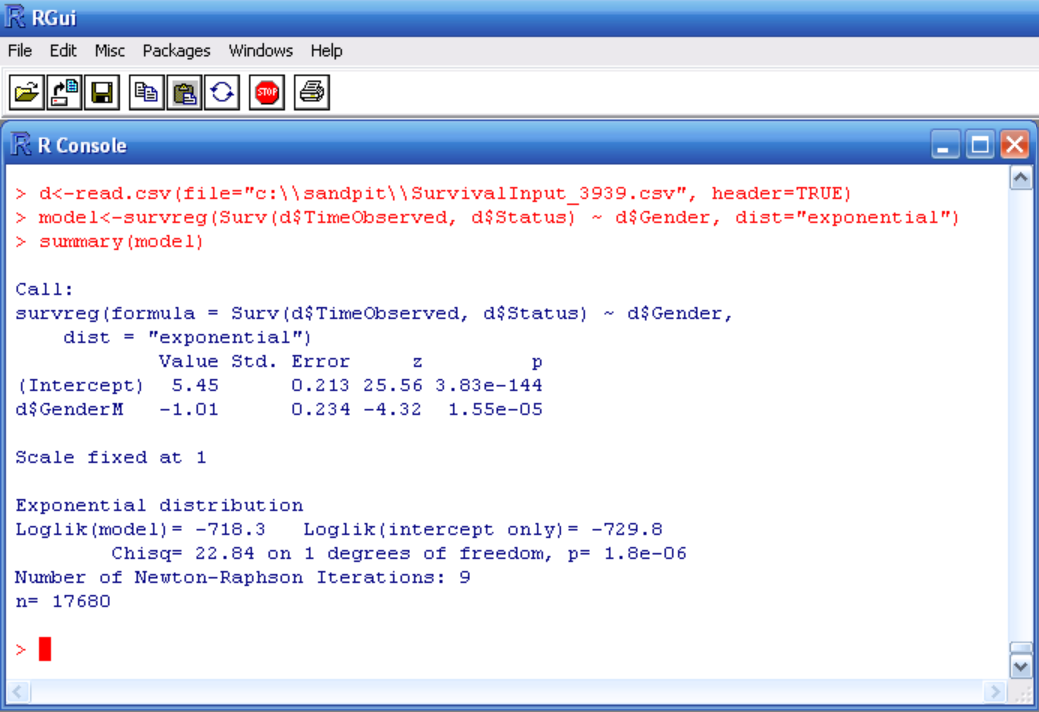
14.9 As can be seen, the estimates, standard errors are the same in both systems, apart from the sign for Gender. This is because R uses a slightly different parameterisation for the survival model, but the estimate and standard error are clearly the same apart from this. We prefer the Longevitas model structure, as it is kept consistent across all the model types for ease of interpretation. Note that R does not automatically give the AIC for its survival models, but we can calculate it from the given value of the log-likelihood as -2 * -718.3 + 2 * 2 = 1440.6, the same as Longevitas.
If you want to see more of Longevitas, please contact us.
Copyright © Longevitas Ltd. All rights reserved.