2D or not 2D?
The Society of Actuaries (SOA) in North America recently published an exposure draft of a proposed interim mortality-improvement basis for pension-scheme work. The new basis will be called "Scale BB" and is intended as an interim replacement for "Scale AA". Like Scale AA, the interim Scale BB is one-dimensional in age, i.e. mortality improvements vary by age and gender only. However, the SOA is putting North American actuaries on notice that a move to a two-dimensional projection is on the cards:
the recommended replacement for Scale AA will likely be two-dimensional tables of gender/age/calendar year mortality improvement rates. RPEC encourages the developers of actuarial software to start reviewing the implications of such a change and consider modifying their systems to handle more complex mortality improvement assumptions.
Society of Actuaries (2012)
In the meantime, however, the proposed interim Scale BB basis is still a one-dimensional vector by age, as shown by the line in Figure 1. What is interesting is how much weaker this basis is compared to the mortality-improvement rates experienced in the wider population. Using the most recently available US population data, one can derive the average annual mortality-improvement rates, which are plotted as points in Figure 1.
Figure 1. Mortality improvements amongst US males 2003–2007 and interim Scale BB improvements. Source: Society of Actuaries (2012) and own calculations using data from the Human Mortality Database.
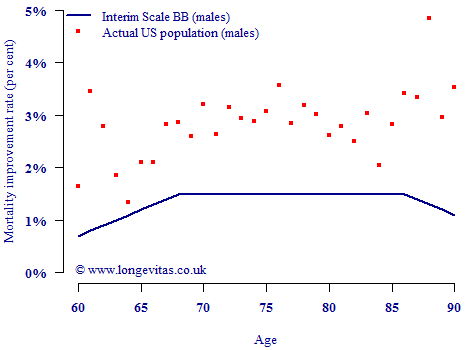
Figure 1 shows that at each age in the 60–90 age range the most recent actual population rate of improvement exceeds the rate in Scale BB. This might have occurred because the SOA used the CMI's projection model, which assumes an immediate trend reversal if the current mortality-improvement rates are higher than the selected long-term target. The SOA selected a long-term improvement rate of 1% per annum and a "relatively short 10-year cohort convergence period", so the trend reversal would have been sharp.
So, we have identified one reason why the SOA's improvements in Figure 1 are less than the recent rates — the trend-reversal nature of the CMI model. However, this doesn't fully explain why the Scale BB rates are so low relative to the recent improvements. After all, if current improvements are 3% per annum (say), and the long-term blended rate is 1%, then surely the effective constant figure would be higher than the 1.5% p.a. maximum shown in Figure 1? The answer lies in the fact that the SOA has determined the Scale BB rates by equating to a deferred annuity to age 62. The result is that Scale BB becomes increasingly deficient above this age.
The SOA working party is preparing North American actuaries for a move to two-dimensional projections of improvements. Perhaps it should also be preparing them for projections with higher short-term improvements?
References:
Society of Actuaries (2012) Mortality Improvement Scale BB Report, September 2012.
Add new comment