Accelerating improvements in mortality
In February 2009 a variation on the Lee-Carter model for smoothing and projecting mortality rates was presented to the Faculty of Actuaries. A key question for any projection model is whether the process being modelled is stable. If the process is not stable, then a model assuming it is stable will give misleading projections. Equally, a model which makes projections by placing a greater emphasis on recent data will be better able to identify a change in tempo of the underlying process.
We take the mortality hazard rates for males in England and Wales and calculate the relative mortality improvement, i.e. the improvement at age x in year y is:
1 - μx,y / μx,y-1
where the rates μx,y have been locally smoothed using a spline smoother with age-year penalties. The animation in Figure 1 shows how the rate of improvement by age has varied since 1962 (click the image to restart the animation).
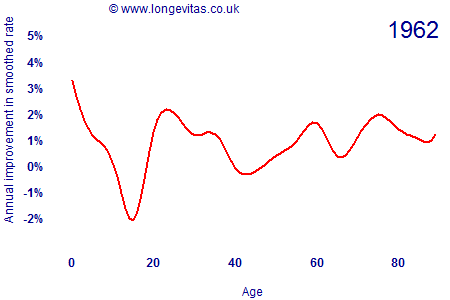
There are several interesting features about Figure 1:
- Mortality improvements are anything but constant, with considerable variation by both age and time. Mortality improvements are clearly a two-dimensional projection problem.
- Mortality improvements were negative for males in their late 20s and early 30s during the 1990s, presumably due to the emergence of the AIDS epidemic.
- The cohort effect for years of birth around 1931 is visible as a peak moving through the ages from 40 onwards. This generation has consistently experienced faster rates of improvement at all ages.
- Rates of improvement have accelerated over time for post-retirement ages. There are year-on-year fluctuations, but the overall trend is of ever-faster improvements. Improvement rates for the 1931 generation have accelerated from under 2% in the early 1960s to around 5% per annum most recently.
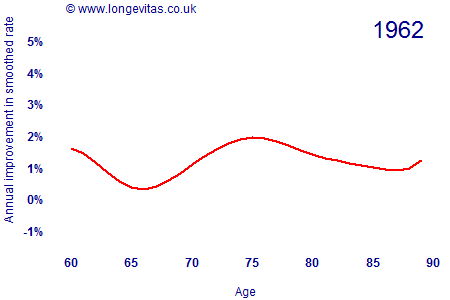
In the paper presented to the Faculty of Actuaries in February 2009, the Currie-Richards model projected stronger mortality improvements than the traditional Lee-Carter model. Figure 1 shows why: the Lee-Carter model implicitly assumes that the mortality-improvement process is stable, whereas the Currie-Richards model picks up on the fact that improvements are accelerating. This is particularly the case for post-retirement ages, as shown in the animation in Figure 2 (click on image to restart the animation).
Add new comment