A head for tails
When an insurer or reinsurer takes on a new insurance risk, there are two things of special interest: the best estimate of the risk and the tail risk. The best estimate is about the current expectation of claim levels or costs, while tail risk is about how bad things could get if the company were unlucky. The UK's ICA regime and the pending EU Solvency II regime are both concerned with tail risk at the 99.5th percentile.
When investigating tail risk, we are talking about the right-hand tail of a loss distribution, i.e. the part which contains the rare-but-costly scenarios. It is therefore critically important that the model used does a good job of estimating the size and shape of this tail. Since the loss is a random variable, actuaries use stochastic models to assess tail risk. Longevity risk is no different from other risks in this respect, and we typically use stochastic projection models for longevity, such as the Lee-Carter model and many others.
One model I came across recently specified a limit to the mortality reduction possible at each age. The parameterization of this limit seemed rather questionable — Oeppen and Vaupel (2002) showed that past attempts to specify a limit to longevity have a poor record. However, a further problem with this sort of model is that it is inappropriate for answering questions about tail risk, such as with Solvency II.
To illustrate this point, Figure 1 shows actual mortality rates for males aged 70, together with some sample-path ARIMA projections based on the DDE extension to the Lee-Carter model. In contrast, Figure 2 uses the same sample-path ARIMA projections apart from an arbitrary maximum possible reduction of 65% compared to 2009 rates.
Figure 1. Open-tailed stochastic projections for males aged 70 in England and Wales. DDE model for mortality calibrated using ONS data between 1961 and 2009.
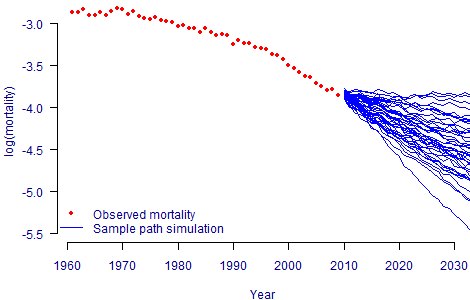
Figure 2. Tail-restricted stochastic projections for males aged 70 in England and Wales. DDE model for mortality calibrated using ONS data between 1961 and 2009, with arbitrary maximum reduction of 65% from 2009.
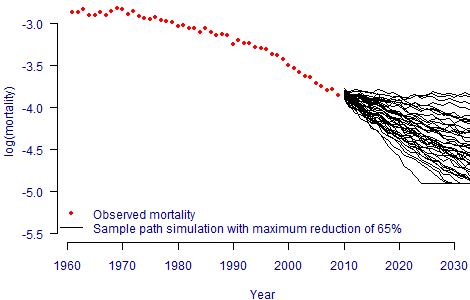
Figure 2 shows that a handful of the scenarios with larger-than-average reductions have been curtailed by the maximum permitted reduction in mortality rate. In valuing an annuity portfolio, this would result in underestimating the rare-but-expensive costs one needs to consider for tail risk. Models with artificial limits to mortality reduction are therefore inappropriate for Solvency II when applied to annuities.
Add new comment