All bases covered
It is fairly obvious by now that we are strong advocates for stochastic projection models. Such models crucially provide a basis with two components - a best-estimate force of mortality by age and year, and matching standard error values for the same 2D range. Not all bases derive from stochastic methods of course, and so called deterministic bases will produce a single estimate without uncertainty measures. A popular example of a deterministic basis in use is that from the CMI, which is updated each year in response to revised data from the ONS and is driven by a user-input expectation of the long-term mortality improvement rate.
Both types of basis are in common usage and are often applied in concert. One example is the use of stochastic models to help inform the selection of a long-term mortality rate for the CMI model, or to use an expectation derived from expert opinion to assist in the selection of a stochastic model for longevity. A more general requirement is simply to explore the degree of support different bases seem to provide for each other at various ages, something that is facilitated by benchmarking both kinds of basis together.
One visual means of doing this is to chart the cumulative mortality reduction factors proposed by each basis (with chosen confidence envelope) for a given age in a single plot - this makes it quite straightforward to pick out features of interest as shown in Figure 1.
Figure 1. Benchmarking default behaviour of the CMI 2011 projection model with a 1.25% long term rate at Age 70 against a Lee Carter smooth alpha-beta stochastic model fitted to E&W Males data 50-95, 1961-2010.
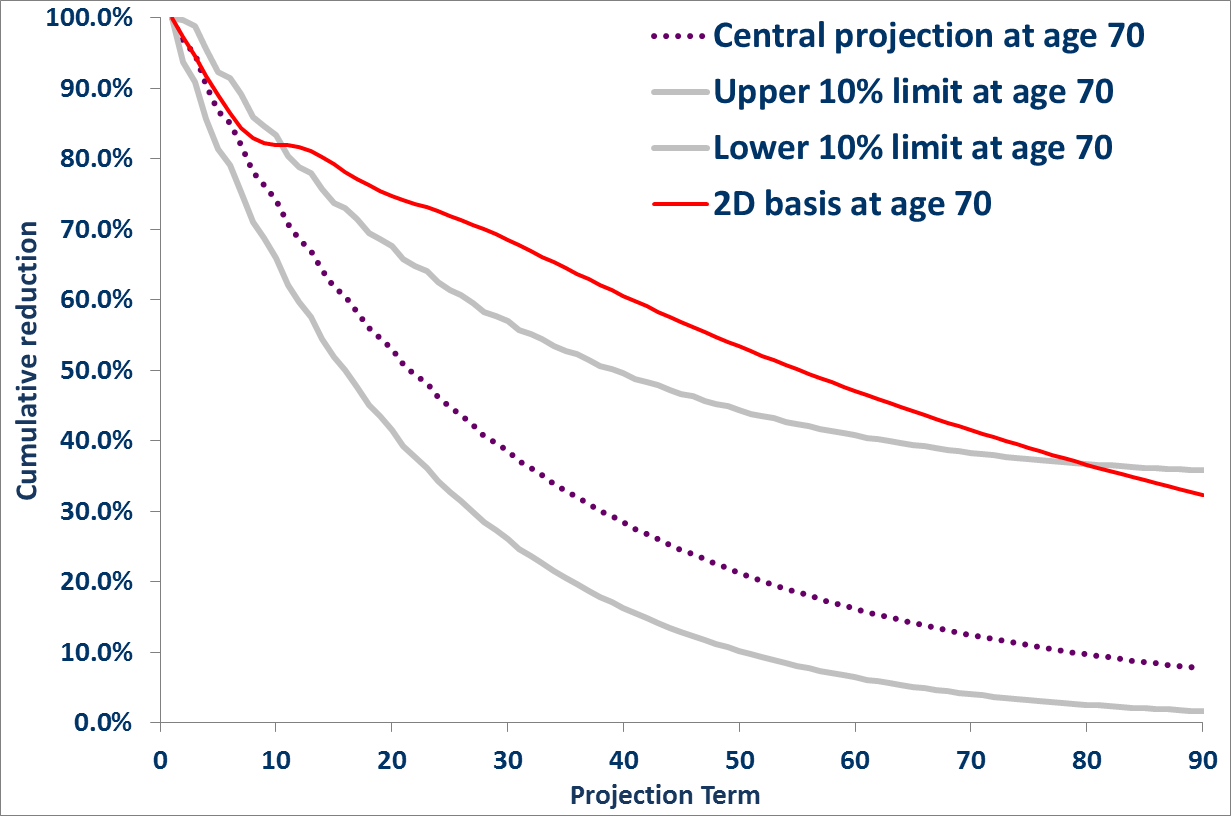
So, what do we see? Near the beginning of our solid red CMI basis line we see an upwards kink as the rapid trend reversal imposed by the default CMI model behaviour kicks in. We then see the deterministic basis forecast lower cumulative reductions than the upper 10% confidence interval for the first eight of the nine decades shown. Depending on your viewpoint this might suggest either that the Lee-Carter model is too prudent for Age 70, or that the CMI model at 1.25% is not prudent enough, but it is clear these bases don't provide close support for each other.
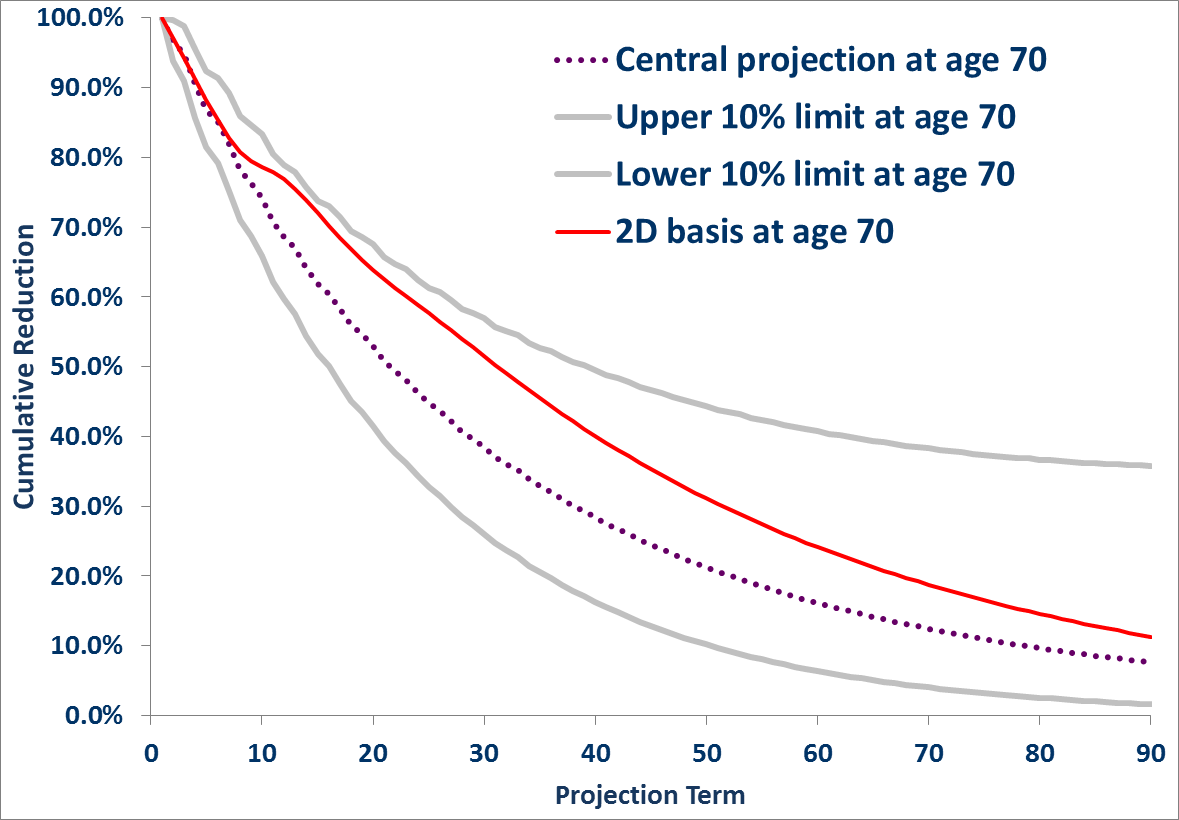
If we examine a different expectation of long term rate, the picture changes significantly. In the Figure 2 the only change is to input a 2.5% expectation to the CMI tool. The trend reversal kink remains, but now our deterministic basis remains within the 10% uncertainty bounds of the Lee-Carter projection for the duration of the forecast.
Figure 2. Benchmarking default behaviour of the CMI 2011 projection model with a 2.5% long term rate at Age 70 against a Lee Carter smooth alpha-beta stochastic model fitted to E&W Males data 50-95, 1961-2010.
Of course, before deciding on the extent any two bases could be said to be in support or conflict we would need to benchmark a range of key ages, since mortality improvements show considerable variation by age and time.
Add new comment