'D' is for deficiency
The United Kingdom has long had persistent regional disparities in mortality, and thus in life expectancy. A large part of this is due to socio-economic mix, as shown in a much earlier blog. However, as Gavin showed in a comparison of three UK cities, socio-economic variation cannot wholly explain Glasgow's excess mortality. There are many possible contributory factors, but in this blog we focus on one: sunshine.
An obvious difference between Scotland and the rest of the United Kingdom is that it gets less sunshine. Figure 1 shows the monthly average hours of sunshine between 1981 and 2010:
Figure 1. Average monthly hours of sunshine across the U.K., 1981-2010. Source: Met Office.
And even when Scotland gets sunshine, the sun's rays are weaker than they are further south as the country:
receives particularly low levels of UVB because its far northern latitude leads to scattering and absorption of UVB by atmospheric oxygen, ozone, and water molecules.
Chaplin & Jablonski (2013)
to which we might add that the modern tendency to live and work indoors means that Scotland's inhabitants today get even fewer ultra-violet rays than their historical counterparts.
What does this have to do with mortality? Well, exposing your skin to UVB between April and September is the main way residents of the Northern Hemisphere get vitamin D, although vitamin D itself is:
just one of several bioactive compounds produced by strong UVR solar exposure that may have an effect on morbidity and mortality.
Jablonski (2014)
How large an impact do sunshine-generated bioactive compounds like vitamin D have? In a large study of Swedish females, Lindqvist et al (2014) found that:
all-cause mortality was inversely related to sun-exposure habits. The mortality rate amongst avoiders of sun exposure was approximately twofold higher compared with the highest sun-exposure group.
Lindqvist et al (2014)
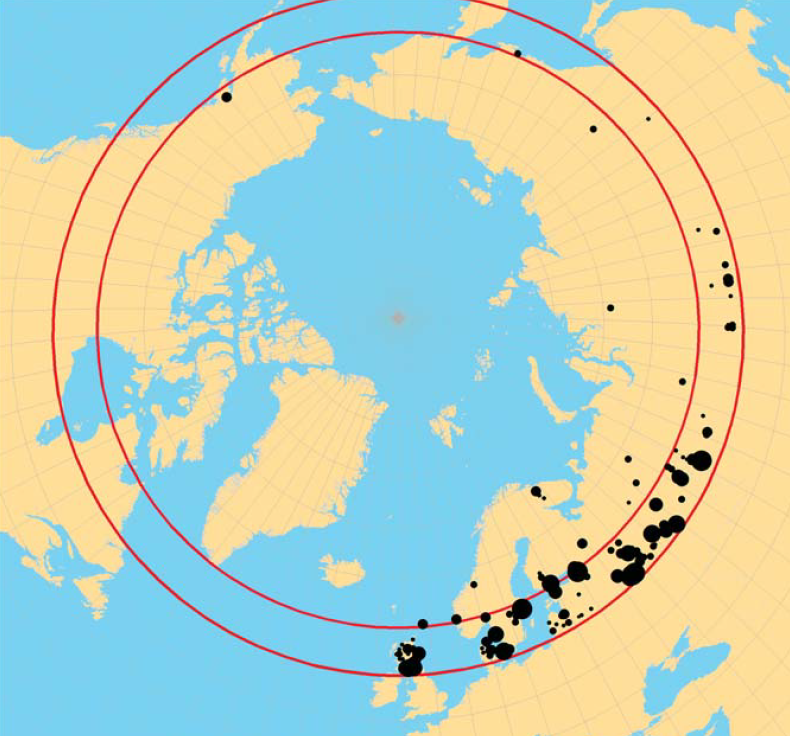
For those interested in the relevance of a Swedish study to Scotland, Figure 2 shows that the two countries have their populations concentrated at very similar latitudes. Indeed, Scotland is a place where weaker UVB rays due to latitude are further reduced by frequent cloud cover.
Figure 2. Distribution of populated places with 25,000 persons or more north of 55° latitude. In this polar projection centred on Scotland, the 55th and 60th parallels are marked to show the approximate latitudinal extent of the country. Scotland's major population centres are at a similar latitude to those of Sweden. Source: Chaplin & Jablonksi (2013).
In a large meta-analysis of numerous studies, Chowdhury et al (2014) noted that vitamin D levels "showed a significant inverse association with all-cause mortality" and that "supplementation with vitamin D3 reduced overall mortality significantly among older adults". With this in mind, it is perhaps unsurprising that the Scottish Government has recommended that residents consider taking a vitamin D supplement between October and March.
References:
Chaplin, G. and Jablonski, N. G. (2013) The Human Environment and the Vitamin D Compromise: Scotland as a Case Study in Human Biocultural Adaptation and Disease Susceptibility, Human Biology, 85(4), pp. 529–552, Wayne State University Press, http://www.jstor.org/stable/10.13110/humanbiology.85.4.0529
Chowdhury, R., Kunutsor, S., Vitezova, A., Oliver-Williams, C., Chowdhury, S., Kiefte-de-Jong, J. C., Khan, H., Baena, C. P., Prabhakaran, D., Hoshen, M. B., Feldman, B. S., Pan, A., Johnson, L., Crowe, F., Hu, F. B. and Franco, O. H. (2014) Vitamin D and risk of cause-specific death: systematic review and meta-analysis of observation cohort and randomised intervention studies, British Medical Journal, 348.
Jablonski, N. G. (2014) Is there a golden mean for sun exposure?, Journal of Internal Medicine, 276, 71–73.
Lindqvist, P. G., Epstein, E., Landin-Olsson, M., Ingvar, C., Nielsen, K., Stenbeck, M. and Olsson, H. (2014) Avoidance of sun exposure is a risk factor for all-cause mortality: results from the "Melanoma in Southern Sweden" cohort, Journal of Internal Medicine, 276, 77–86.
Add new comment