Are you allergic to statistical models?
Or do you know someone who is? Some people are uncomfortable with the idea of statistical models, especially ones with parameters. It is worth remembering that in 1958 Kaplan and Meier introduced the idea of an empirical survival curve, also called the product-limit estimator. The basic idea is to re-arrange the mortality experience data in such a way as to demonstrate the survival rates of different sub-groups. The key feature of the Kaplan-Meier curve is that there are no parameters involved: the empirical survival curve is simply a re-arrangement of the experience data, and involves no model fitting and no parameter estimation.
In the chart below we show the Kaplan-Meier curves for males and females in a large annuity portfolio:
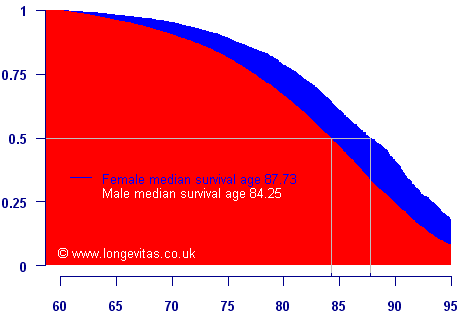
We see what we would have in any case expected: for any given age, females have a higher probability of survival than males. The red area is the average time lived for a male, while the blue area is the average time females live longer than males.
Survival curves are widely used in the analysis of medical trials, where a key piece of information is the point at which half of the members of a group are dead (or, equally, the point to which have of all members survive). In the chart above, the mid-way point at which half of all lives are dead is simply the median survival age. It is higher for females due to their lower mortality and longer life expectancy.
Survival analysis provides a very visual means of communicating results to people who are unfamiliar with parametric models. Empirical, model-free survival curves are possible for any categorisation you like, including socio-economic or lifestyle group, as shown in this article on analysing annuitant mortality without parametric models.
Add new comment