Is your mortality model frail enough?
Mortality at post-retirement ages has three apparent stages:
A broadly Gompertzian pattern up to age 90 (say), i.e. the mortality hazard is essentially linear on a logarithmic scale.
The rate of increase in mortality slows down, the so-called "late-life mortality deceleration".
The rate of increase slows down to the point where the mortality rate looks like it might be constant above a certain age (110, say).
In my previous blog I demonstrated the power of the Newman hypothesis, namely that low-frequency errors in stated age can cause the patterns in Stage 2 and (especially) Stage 3. However, the Newman hypothesis is not the only means whereby apparently simple Gompertz mortality turns into something more complex. There is another very plausible driver for the deceleration in Stage 2: unobserved risk factors.
To illustrate this, consider a cohort of lives following the Gompertz mortality law:
\[\mu_x=e^{\alpha+\beta x}\]
at age \(x\) for given \(\alpha\) and \(\beta\). We will assume that the lives all share a common value of \(\beta=0.1\), i.e. lives "age" at the same constant rate. However, we will further assume that there are two subgroups with different values of \(\alpha=-12\) and \(\alpha=-11\). This is a very large difference, far larger than the difference between smokers and non-smokers for example, but it serves to make the underlying phenomenon clearly visible. Crucially, we assume that we do not know who belongs to each subgroup, i.e. there is heterogeneity in the population that we cannot model. Figure 1 shows the resulting aggregate mortality hazard if the two subgroups start out in equal proportion at age 65.
Figure 1. Effect of an unobserved risk factor on mortality analysis. Without the ability to identify the risk factor separating the two groups, the mortality hazard has a different shape from either subgroup. Source: own calculations using Gompertz model for each subgroup.
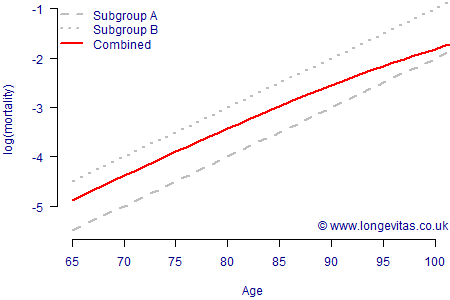
Figure 1 shows how an apparent deceleration in the rate of increase of mortality arises from (i) the different mortality rates of the subgroups and (ii) the changing proportions of those subgroups as the higher-mortality subgroup shrinks faster. Like the Newman hypothesis, unobserved heterogeneity is a simple-but-powerful idea that can explain apparent late-life mortality deceleration. The Newman hypothesis and unobserved hetereogeneity are both inherently plausible explanations; while the Newman hypothesis only needs rare errors in stated age, unobserved heterogeneity is largely the norm for defined-benefit pension schemes and annuity portfolios. Consider again the previous example of smoker status; smoking is a particularly strong risk factor for mortality, yet for most pensioner portfolios the smoker status of each life is unknown. Proxy risk factors, such as pension size or geodemographic group, can only be imperfect substitutes. Thus, almost every portfolio contains unobserved heterogeneity, and so almost every portfolio exhibits decelerating rates of increase in mortality at advanced ages.
This unexplained hetereogeneity goes by the name of frailty in demographic circles. In Richards (2008) I demonstrated the derivation of some specific mortality models allowing for frailty, together with references to past academic work on the subject. In Richards (2012) I surveyed different mortality models for application to pensioner mortality and found that one frailty model (Makeham-Beard) consistently fitted actual portfolio data better than the sixteen other models considered. Figure 1 shows the reason for this: frailty models are better at handling unobserved sources of variation.
References:
Richards, S. J. (2008) Applying survival models to pensioner mortality data, British Actuarial Journal, 14(II), pages 257-326 (with discussion).
Richards, S. J. (2012) A handbook of parametric survival models for actuarial use, Scandinavian Actuarial Journal, 2012(4), pages 233-257.
Add new comment