Reporting delays
When performing a mortality analysis, it is my practice to disregard the most recent six months or so of experience data. The reason is delays in the reporting and recording of deaths, i.e. occurred-but-not-reported (OBNR) to use the terminology of Lawless (1994). We use the term OBNR, rather than the more familiar term IBNR (incurred-but-not-reported); IBNR is associated with "cost-orientated" delay distributions of insurance claims (Jewell, 1989), whereas we are focused on just the delay itself.
But what evidence is there to support my six-month rule of thumb? As part of ongoing research in Richards (2021), I received separate extracts of annuitant mortality experience in June and September 2020 from two insurers: one French, one British. By matching up the annuities in successive extracts, I identified cases that were marked as in-force in the June extract, but which were marked as pre-June deaths in the September extract. These cases were therefore late-reported deaths, i.e. they had occurred before the June extract but hadn't been reported to the insurer at the time of extract. Figure 1 shows the three possibilities for a pre-June death occurring on a given date:
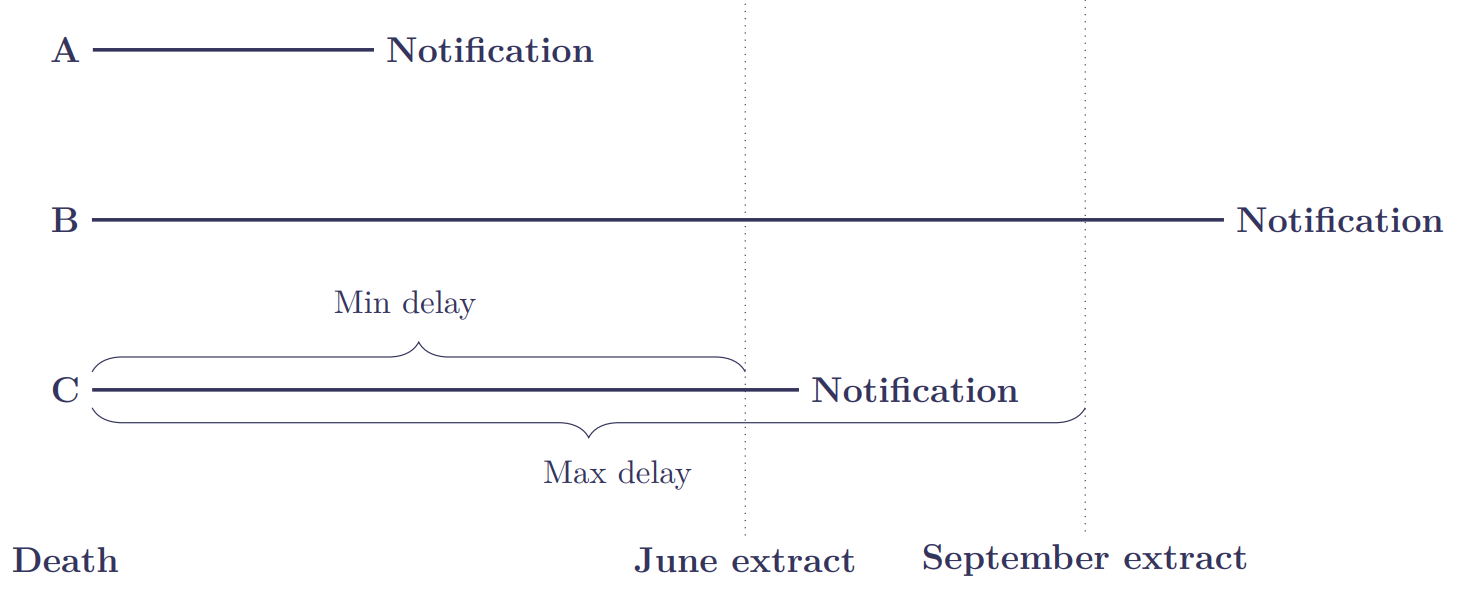
In Figure 1, Death A occurs and is reported before the June extract. Death B occurs before the June extract, but isn't reported until after the September extract; we therefore know nothing of Death B. Death C occurs before the June extract, but is reported sometime between the June and September extracts. We note that comparing these two extracts gives us incomplete information on the reporting delays:
- Type A. Without separate recording of notification dates, we know nothing of the delay between death and its notification; our delay times are therefore left-truncated.
- Type B. Not all pre-June deaths will have been reported by the time of the September extract; our delay times are therefore right-truncated.
- Type C. We don't know precisely when such pre-June deaths were notified, only that they had been notified by the time of the September extract. We therefore know that each delay time is at least the difference between the date of death and the date of the June extract (this is the "Min delay" in Figure 1). We also know that the delay is at most the difference between the date of death and the date of the September extract (this is the Max delay in Figure 1). Our delay times are therefore interval-censored.
With these limitations in mind, Table 1 shows the data that we have. We note that the FRA portfolio has a greater problem with late-reported deaths, as it has more Type C deaths and fewer Type A deaths; the ratio of late-reported to reported deaths is therefore far higher for the FRA portfolio.
Table 1. Reporting delays for annuitant mortality observed between successive data extracts in 2020. Source: Richards (2021).
| FRA | UK | |
|---|---|---|
| Last date of death in first extract (\(u_1\)) | 17 June | 17 June |
| Type A deaths in 2020 | 1,171 | 2,045 |
| Last date of death in second extract (\(u_2\)) | 17 Sept. | 15 Sept. |
| Type C deaths reported in \((u_1, u_2]\) | 853 | 488 |
| Ratio of Type C deaths to Type A deaths | 0.729 | 0.239 |
| Median minimum delay | 54 days | 39 days |
| Longest minimum delay | 15.95 years | 24.48 years |
Figure 2 shows the distribution of minimum delays for Type C late-reported deaths for each portfolio:
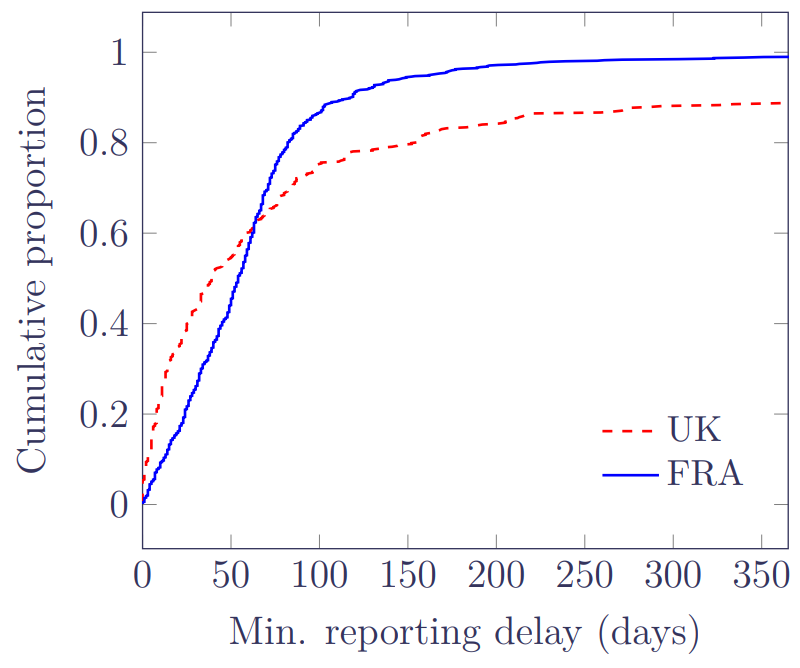
Figure 2 shows that the UK portfolio has an initially strong rate of reporting, but that this then tails off quickly with a substantial proportion of delays lasting at least a year. In contrast, the French portfolio has an initially slower rate of reporting, but most deaths seem to be reported within half a year. While the delays in the FRA portfolio look better in Figure 2, it must be remembered that the FRA portfolio has a far higher ratio of Type C deaths to Type A, and so has a bigger OBNR problem overall.
So what does this mean for my six-month rule of thumb for mortality analysis? We cannot just look at the distribution of delays in Figure 2, as the two portfolios have very different ratios of Type C deaths to Type A deaths. We must therefore look at the impact on the mortality estimate overall. To do this, we can use the semi-parametric estimator for time-varying mortality, \(\hat\mu_y\), defined in my previous blog. We define the following ratio:
\[R=\frac{\hat\mu_y {\rm using\ June\ extract}}{\hat\mu_y {\rm using\ September\ extract}}\qquad(1)\]
\(R\) will give an idea of the impact of reporting delays by showing the proportion of deaths known at the extract date in June. In fact, \(R\) will under-state the true impact, as the denominator relies on all pre-June deaths having been reported by the September extract, something we know not to be quite true because of the existence of Type B deaths. Plots of \(R\) for the two portfolios are shown in Figure 3:
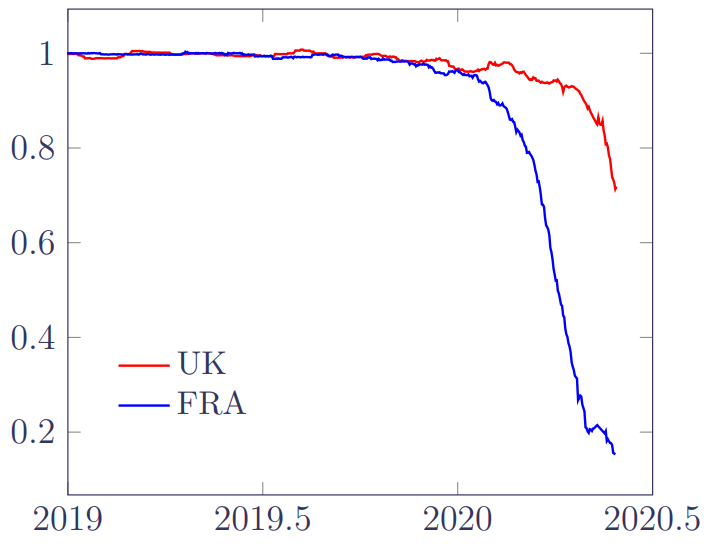
Figure 3 broadly confirms the six-month rule-of-thumb: late-reported deaths have minimal impact half a year or more prior to the extract date, as the ratio is close to 1. After that, however, the impact of OBNR deaths becomes more dramatic, especially for the FRA portfolio. The reason that this is important is twofold: first, mortality levels would be under-estimated if we included the most recent OBNR-affected period; and second, improvement rates would be over-stated as the OBNR effects were conflated with the time trend.
References:
Jewell, W. S. (1989) Predicting IBNYR Events and Delays: I. Continuous Time, ASTIN Bulletin, 19(1), pages 25–55, doi: 10.2143/AST.19.1.2014914
Lawless, J. F. (1994) Adjustments for reporting delays and the prediction of occurred but not reported events, Canadian Journal of Statistics, 22(1), pages 15–31, doi: 10.2307/3315826.n1.
Richards, S. J. (2021) Mortality shocks and reporting delays in portfolio data, Longevitas working paper.
Previous posts
Visualising data-quality in time
Visualising covid-19 in experience data
As 2020 edges to a close, life-office actuaries need to set mortality bases for year-end valuations. An obvious question is what impact the covid-19 pandemic has had on the mortality experience of their portfolio? One problem is that traditional actuarial analysis was often done on the basis of annual rates, whereas the initial covid-19 shock was delivered over a period of a couple of months in early 2020 in Europe.
Add new comment