Self-selection
Actuaries valuing pension liabilities need to make projections of future mortality rates. The future is inherently uncertain, so it is best to use stochastic models of mortality. Unfortunately, such models require a long enough time series, but few (if any) portfolios have such data. In the UK actuaries typically rely on one of two alternative data sets: the England & Wales data from the ONS, which goes back to 1961, or the "assured lives" data from the CMI, which goes back to 1947. An earlier post contains an animation showing how the CMI data has changed dramatically over this period.
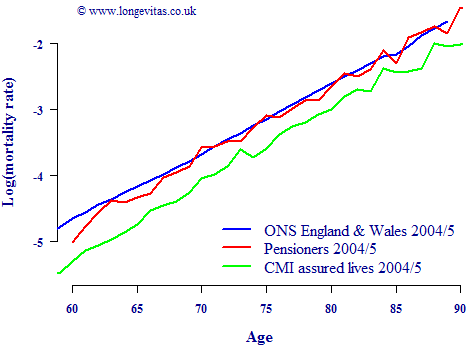
However, a model for the mortality of one group may not be directly suitable for projecting the mortality of another group, which is a form of basis risk. Figure 1 shows just how different mortality rates can be, even though in each case we are dealing with mortality rates for male lives aged 60-89 from 2004 to 2005. Somewhat unexpectedly, the mortality of the defined-benefit pensioners is closer to that of the wider population than it is to the CMI assured lives group. This suggests that a stochastic model parameterised using population data would be more appropriate for projecting pensioner mortality.
Figure 1. Log mortality rates for male lives between 2004 and 2005
Differences such as those in Figure 1 are usually ascribed to different socio-economic mix. People in private defined-benefit pension schemes have a slightly more up-market profile than the wider population, for example. Similarly, people who have free money to invest in life-insurance policies have an even more up-market profile. An effective way of identifying lifestyle or social status is to use postcode profiling, or geodemographics, so we can split the pensioners into two groups of low and high status. This is shown in Figure 2, where the low- and high-status pensioner rates now straddle the population rates, with evidence of convergence at advanced ages:
Figure 2. Log mortality rates for male lives between 2004 and 2005
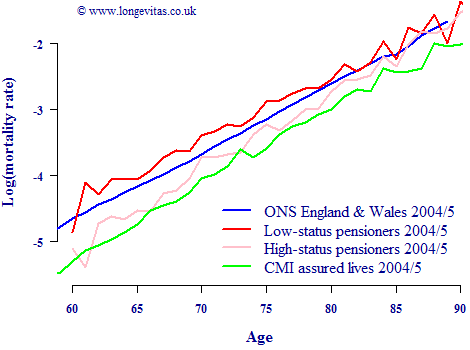
Figure 2 shows just how super-select the CMI data really is - the aggregate CMI mortality rates at these ages are lower than even the high-status DB pensioners. People who voluntarily save via life-insurance contracts (and can afford to do so) are a self-selected group compared to people who are automatically enrolled in their employer's pension scheme.
Add new comment