Stabilising projections
With many stochastic models of mortality, projections of future mortality rates are done using a time series. In a landmark paper, Currie, Durban and Eilers (2004) introduced the idea of using P-splines as an alternative means of generating a forecast. P-splines formed the basis of a projection tool the CMI made freely available in 2005.
An oft-heard criticism of P-spline projections is that they can be volatile from year to year when adding new data. This criticism was repeated in a recent paper by the CMI's projections working party:
"[...] the Working Party was concerned that adopting a P-spline methodology could introduce [an] unwanted "edge effect", i.e. that the initial rates of improvement for the final year of the data would be unduly influenced by the relative level of experience in that final year and hence would vary materially from one year to the next."
CMI Working Paper 39, page 4
An illustration of what is meant by "edge effect" is given in Figure 1. A P-spline projection is made using ONS data from 1965-2005 (shown as a solid red line), then repeated using an extra two years' data (shown as a dashed blue line). As we can see, the projection has indeed changed direction due to these extra two years of data.
Figure 1. Observed, smoothed and projected mortality rates for E&W males aged 70. ONS data for males aged 40-104 smoothed using 2D age-period model with dx=dy=5
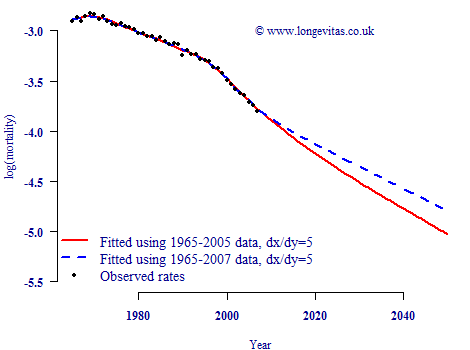
However, the phenomenon described in Figure 1 is not a feature of P-splines. Rather, it is a result of a (typically unconscious) decision by the user, namely using a small gap between successive spline knots. In the CMI's own P-spline projection tool this gap defaulted to 5 years, which is the value used in the models behind Figure 1. If we increase this gap to ten years, for example, we achieve a far greater degree of projection stability, as shown in Figure 2.
Figure 2. Observed, smoothed and projected mortality rates for E&W males aged 70. ONS data for males aged 40-104 smoothed using 2D age-period model with dx=dy=10
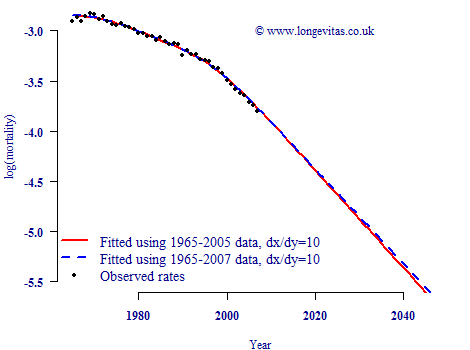
What's going on? Well, the P-spline approach is an extrapolative stochastic projection method. This means that it extrapolates recent trends into the future. The definition of "recent" is largely determined by the gap between the last two splines, which combines with a quadratic penalty to produce a linear forecast. If the last two splines are separated by five years, then adding a further two year's data will have a relatively large impact. However, if the last two splines are separate by ten years, then adding two years' data will have a more modest impact.
In short, P-spline projections are only prone to edge effects if the user decides to allow them. Rather than being in any sense unstable, P-spline projections offer an actuary the ability to specify just how stable the forecast should be. The user can choose a sliding scale between high stability (and therefore slow responsiveness to new trends) or lower stability (and therefore a faster response to a new trend).
Comments
Whilst your comments look pertinent to concerns on the edge effect, crudely backing out numbers from your graph, it looks as if the two 5 year knot projections give roughly 2.4% pa and 2.8% pa rates of improvement over 33 years, but using the 10 year knot projections give roughly 4.4% pa improvements.
Thus model uncertainty could be a larger problem than edge effect if there really is no good reason for not using 10 year knots rather than 5 year knots.
Regards
Brian
brian.wilson@hewitt.com
Model risk was out of scope for this blog post, but this isn't to deny that it is a big issue! Forecasting is almost entirely model driven so model risk is the big issue for forecasters. Iain Currie and I illustrated the size of the problem in the paper we presented to the Faculty of Actuaries Sessional meeting in February 2009, which can be found at http://www.richardsconsulting.co.uk/project.html
Add new comment