The weaker sex
Last year Iain wrote about a smooth model to identify mortality shocks, using Swedish population data to illustrate the impact of the 1918 influenza pandemic. The ratio of male mortality rates in 1918 to those in 1917 is shown in Figure 1.
Figure 1. Ratio of mortality rates in 1918 to mortality rates in 1917. Source: own calculations using Swedish population data (males only) from the Human Mortality Database.
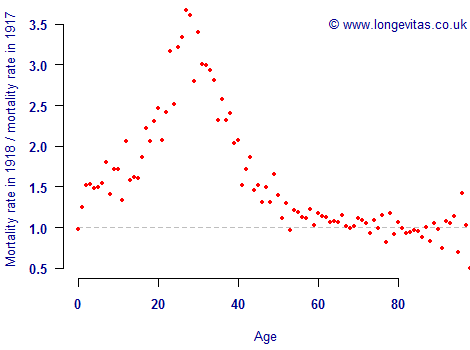
From a Solvency II perspective, Figure 1 is uncomfortable for a life insurer with a mixed portfolio of life assurance and annuity risks. There is huge excess mortality at the term-assurance ages 25–45, but little excess mortality at pensioner ages 60 and over. This means that a term-assurance portfolio and an annuity portfolio would not have acted as a mortality or longevity hedge — there would be no profits on the annuity portfolio to offset the losses on the term assurances.
Another feature of life-assurance portfolios is that often more than half of liabilities are on male lives. It is therefore interesting to see whether males and females respond differently to mortality shocks. We can calculate the same ratio in Figure 1 for females and subtract it from the male ratio to see if males exhibit a higher or lower shock response. The difference in ratios for the 1918 influenza pandemic is shown in Figure 2:
Figure 2. Male ratio from Figure 1 minus equivalent female ratio. Source: own calculations using Swedish population data from the Human Mortality Database.
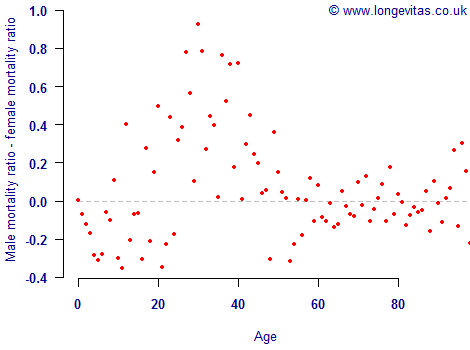
Figure 2 shows that females exhibited a higher shock response under age 20 — the difference in ratios is negative. However, males exhibited a much higher shock response in the key term-assurance age range 25–45, as the difference in ratios is strongly positive. When calibrating mortality or longevity shocks for Solvency II, it is important to be aware of potential age- and gender-specific responses to the shock event.
Add new comment