Applying the brakes
The CMI has released a second version of its deterministic targeting model for mortality improvements. This type of model is called an expectation, as the user must enter their belief for the long-term rate of mortality improvement to use the tool. Expectations have their own unique features, as discussed in an earlier blog. The CMI's tool has some unusual features, which I highlighted at the recent public meeting in Edinburgh. A copy of these comments can be downloaded on the right.
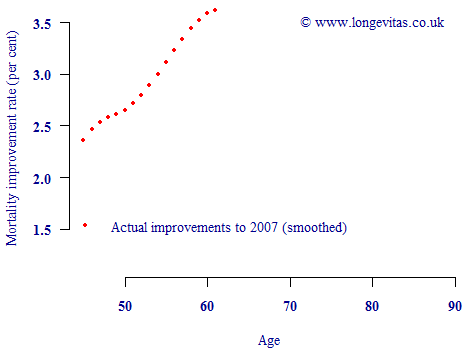
However, there is one particular feature of the core model which must be emphasised, namely that it automatically projects decelerating rates of improvement. By way of illustration, consider people born in 1946 who will attain age 65 during 2011. Figure 1 below shows the smoothed mortality-improvement rates actually observed for males in this generation:
Figure 1. Smoothed actual mortality-improvement rates for lives born in 1946. Source: improvement rates labelled "actual" in CMI 2010.

Figure 1 shows that this generation is retiring with a history of at least seventeen years of accelerating improvements. A reasonable extrapolation of this trend would assume that mortality improvements would continue accelerating, or perhaps slowly plateau for a while. For insurers selling annuities in 2011, it is important to err on the side of caution here as profitability is particularly dependent on the mortality rates in the early years of the contract.
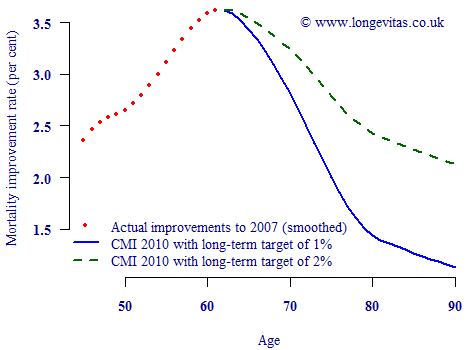
However, the default configuration of the CMI's core projection model is such that mortality improvements immediately decelerate if the long-term target rate is lower than the most recently observed improvement. This leads to an immediate trend reversal, as shown in Figure 2:
Figure 2. Smoothed actual mortality-improvement rates for males born in 1946, together with projected rates according to CMI 2010 model using default parameters and a long-term target of 1% improvement per annum.

It is not unreasonable to assume that mortality improvements will peak at some point. However, it is not realistic to assume that mortality improvements will immediately decelerate for all years of birth, and it is certainly not prudent for pricing or reserving. Users of the CMI projection tool must therefore use the advanced parameter settings to override this behaviour. Details can be found on pages 14–16 of the CMI 2010 user guide.
Previous posts
Keeping it simple — postscript
Keeping it simple
Which mortality-improvement basis is tougher — a medium-cohort projection with a 2% minimum value, or a long-cohort projection with a 1% minimum?


Add new comment