Mortality patterns in time
The COVID-19 pandemic has created strong interest in mortality patterns in time, especially mortality shocks. Actuaries now have to consider the effect of such shocks in their portfolio data, and in this blog we consider a non-parametric method of doing this.
In an earlier blog, Angus talked about mortality data being "nearly always lumpy", and defined the Nelson-Aalen estimator of the integrated hazard from age \(x\) for such lumpy data:
\[ \hat{\Lambda}_x(t) = \sum_{t_i \le t} \frac{d_{x+t_i}}{l_{x+t_i^-}} \qquad (1) \]
where \(d_{x+t_i}\) lives die at a discrete age \(x+t_i\). \(t_i\) is one of a set of observed times of death after age \(x\), \(\{t_1, t_2, \ldots, t_r\}\). \(l_{x+t_i^-}\) is the number of persons observed alive just before age \(x+t_i\). To estimate the mortality hazard by age, \(\hat\mu_x\), we would need to take first differences of a smoothed version of \(\hat{\Lambda}_x(t)\), and Anderson et al (1992, page 579) discuss using kernel smoothers for this.
However, what if we substitute time for age in equation (1)? This will give a non-parametric estimator for the integrated hazard by time, \(y\), as follows:
\[ \hat{\Lambda}_y(t) = \sum_{t_i \le t} \frac{d_{y+t_i}}{l_{y+t_i^-}} \qquad (2) \]
where the definition of each \(t_i\) is now different because we are calculating on each date of death, not each age at death. This is an interesting change because the period spanned by the experience data of most portfolios is usually just a handful of years, as opposed to the fifty-year span of age from age 50 (say). As a result there is a much smaller gap between calculations, and for large portfolios there is often at least one death every single day. This gives rise to a near-continuous estimate of the integrated hazard, as shown in Figure 1.
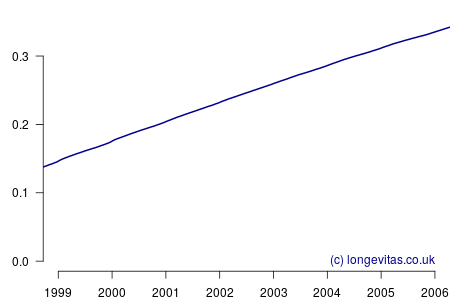
Figure 1 is relatively uninteresting; it appears to be a near-perfectly smooth straight line. This impression could scarcely be further from the truth, as can be revealed by estimating the mortality hazard as follows:
\[\hat\mu_y(t) = \frac{1}{c}\left(\hat{\Lambda}_y(t+c/2)-\hat{\Lambda}_y(t-c/2)\right)\qquad(3)\]
for some smoothing parameter \(c>0\). Equation (3) is a uniform kernel smoother and the results for varying values of the bandwidth parameter \(c\) are shown in Figure 2.
Figure 2 shows a surprising rich amount of detail, given that it is derived from the rather boring Figure 1. We can see that the non-parametric estimator can clearly identify the seasonal variation in mortality for a wide variety of values of \(c\). Lower values of \(c\) apply less smoothing, and in Figure 2 this enables the identification of the winters of 1999/2000 and 2000/2001 as experiencing particularly heavy mortality. As I showed in a (much) earlier blog, these were winters of heavy excess mortality in the population of England & Wales.
Unlike grouped counts of population data, the use of individual records underlying Figure 2 brings out the sharpness of the spike in deaths in the winters of 1999/2000 and 2000/2001. This spikiness brings us back to our opening premise, namely the COVID-19 mortality shock and how actuaries can detect it in their portfolio data. Figure 2 shows that the estimators in equations (2) and (3) are very effective in detecting not just seasonal mortality fluctuations, but, for small values of \(c\), they can also detect short-lived mortality shocks. More details of the estimators and their application can be found in Richards (2020).
References:
Anderson, P. K., Borgan, Ø., Gill, R. D. and Kelding, N. (1992) Statistical models based on counting processes, Springer.
Richards, S. J. (2020) A non-parametric estimator for mortality shocks, working paper, Longevitas Ltd.
Add new comment