Reviewing forecasts
When making projections and forecasts, it can be instructive to compare them with what actually happened. In December 2002 the CMI published projections of mortality improvements that incorporated the so-called "cohort effect" (CMIB, 2002). These projections were in use by life offices and pension schemes in the United Kingdom from 2003 onwards. Since population mortality rates are now available for the ten-year period since then, we can compare actual improvements to the projections from 2003. This is done in Figure 1.
Figure 1: Population mortality improvements 2003–2013 and corresponding CMI cohort projection bases. Source: Own calculations using national life tables from the ONS and the cohort projections from the CMI.
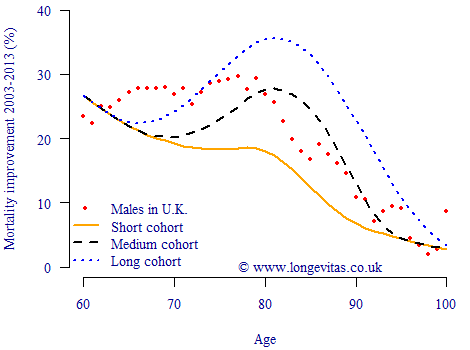
Figure 1 shows that the short cohort projection was wholly inadequate, having predicted improvements well below those actually experienced at almost all ages. Fortunately, most life offices used a strengthened version of the medium cohort projection, often by subjecting the annual improvement rate to a floor value or else by blending the medium and long cohort projections.
However, a closer look at Figure 1 suggests that this picture is less rosy than it seems. The actual improvements below age 80 have been far stronger than the medium cohort projection, while the actual improvements for many ages below 75 were stronger than even the long cohort projection. Visually it might seem that the long cohort projection balances this out with far stronger improvements above age 80 than those actually experienced. However, this would be a mistaken conclusion, as improvements at different ages are not of equal financial importance. As we saw with a much earlier posting, annuity profitability is critically dependent on the mortality rates in the first few years after an annuity is written. Those high rates of improvement up to age 80 will therefore have been quite expensive.
It is worth remembering that the comparison in Figure 1 is not quite as straightforward as it seems. The actual improvements are for males in the wider population of the U.K., whereas the cohort projections were applied to pensioner and annuity liabilities. People in receipt of occupational and private pensions are a select sub-group of the population, so using population data is not a perfect comparison. Furthermore, the cohort projection bases themselves were created using experience data for assurances, not pensions and annuities, so there is more basis risk here than meets the eye. Nevertheless, Figure 1 shows that mortality improvements for males in the U.K. have been stronger at financially key ages than was anticipated back in 2003.
References:
Continuous Mortality Investigation (2002) An interim basis for adjusting the 92 series mortality projections for cohort effects, Working Paper 1.
Add new comment