Ahead of the curve
In an earlier post we looked at the implications for savers of the historically low interest rates in the UK. Low interest rates are a policy response to the unusual economic conditions in which the developed world currently finds itself. Besides being bad for savers, low interest rates increase the value of liabilities for pension schemes and can thus aggravate pension deficits.
However, these record low interest rates only apply in the short term, with a steep rise to a more normal longer-term rate. This is shown in Figure 1, which plots the redemption yields for UK government gilts on 16th December 2011. The points appear to follow a smooth underlying pattern, known as the yield curve.
Figure 1. Redemption yields on 16th December 2011 for principal payable by UK government. Excludes index-linked gilts. Source: Debt Management Office.
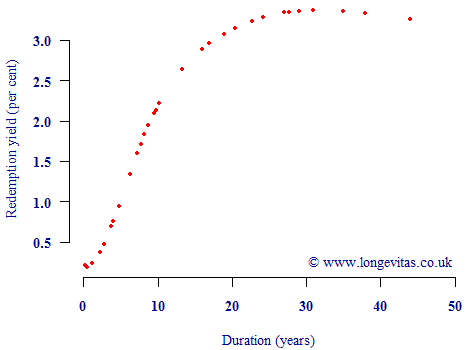
The smooth pattern in Figure 1 could be captured in a mathematical formula, and this would be useful for two reasons. First, such a formula would enable the estimation of a market-consistent yield at durations other than those for which yields are available. This would be helpful in calculating liability values for pension payments. Second, a formula would also permit extrapolation to durations beyond the highest data point available. Again, this would be useful for pension schemes which often have cashflows well beyond the 44-year limit in Figure 1.
There are various models for the yield curve, all of which aim to do the same thing: reproduce the broad underlying pattern of yields, while giving a formula which can be used to both interpolate yields and extrapolate them to longer terms. An illustration of this is given in Figure 2, which shows the popular Svensson (1994) model fitted to the yield data in Figure 1.
Figure 2. Redemption yields on 16th December 2011 for principal payable by UK government, together with fitted Svensson yield curve. Excludes index-linked gilts. Source: Debt Management Office, own calculations.
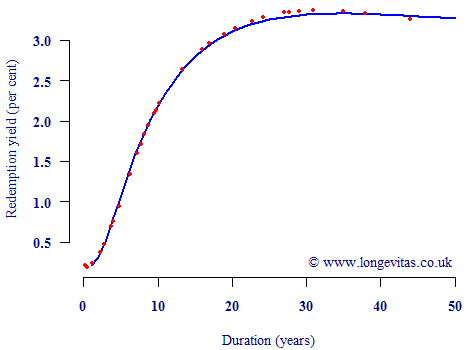
Figure 2 shows that the model captures the broad shape of the yield curve, and also provides a sensible-seeming extrapolation of rates beyond the upper limit of the data. Bearing in mind the strong curvature in Figures 1 & 2, using the yield curve to discount future payments is more appropriate than picking a single constant rate of interest.
References:
L. E. O. Svensson (1994) Estimating and interpreting forward interest rates: Sweden 1992– 1994. Working paper of the International Monetary Fund, 94.114.
Add new comment