Battle of the Bulge
[Regular visitors to our blog will have guessed from the title that this posting is about obesity. If you landed here looking for WWII material, you want the other Battle of the Bulge.]
As winter gives way to spring here in the Northern Hemisphere, many New Year's Resolutions, will have faltered. Along with stopping smoking, losing weight is one of the more common goals, not least because the fortnight preceding the New Year is usually one of considerable excess in eating and drinking (that goes for this author, too). However, reducing obesity and improving health is back on the agenda, as these are the specific aims of the UK's tax on sugary drinks, which was introduced in April 2018.
Losing weight (or, more accurately, losing body fat) has taken on ever-greater significance in recent years. The U.K. was labelled the "Fat Man of Europe" by its very own National Health Service (NHS). The reason for the NHS's interest is simple: excess body fat is associated with a number of chronic illnesses, and the NHS has to treat these. This ties up considerable health resources that could be applied elsewhere. For this reason the excess body fat of the individual is a public-health concern, and the link between obesity and socio-economic group means it is also of interest to those looking to narrow socio-economic differentials.
There are several ways whereby one could measure body fat, both directly and indirectly. However, most people find it easier to use the indirect methods of measuring corpulence by measuring their body weight, height and other dimensions. One of the commonest such indirect methods is the Body-Mass Index (BMI), defined as follows:
\[{\rm BMI} = \frac{w}{h^2}\]
where \(w\) is the weight in kilograms and \(h\) is the height in metres. There is some debate about whether someone can be both fat and fit, and the BMI has a number of important limitations; individuals will therefore have to consider its applicability to them. However, it has been widely used in studying mortality, so we will use it here. Figure 1 shows the relative mortality risk by BMI, after adjusting for confounding factors like age, study, physical activity, alcohol consumption, education, and marital status.
Figure 1. Relative mortality risk by BMI. Source: Berrington de Gonzalez et al (2010). The solid dots are the risk relative to the 22.5–24.9 category, plotted against the mid-point of each BMI interval. The dashed lines are the interpolated spline curves between these observations.
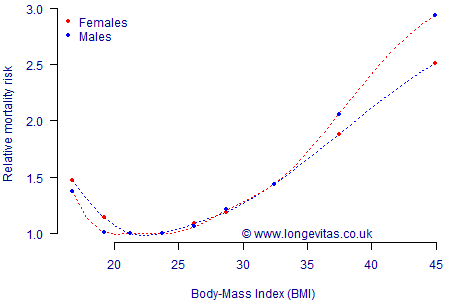
Figure 1 shows that risk is lowest for those with a BMI between 20 and 25, with risk increasing the further people lie outside this range. A BMI figure between 25.0 and 29.9 is classed as overweight, and there is a measurable additional mortality risk. A BMI above 30.0 is regarded as obesity, which is where material health risks arise and thus excess mortality. At BMI values 35 and over the relative risk becomes comparable to smoking, while BMI values of 40 and over have relative risks greater than the smoker v. non-smoker comparison (the relative risks shown in Figure 1 are for healthy adults who have never smoked).
References:
Berrington de Gonzalez et al (2010) Body-mass index and mortality among 1.46 million white adults, New England Journal of Medicine, 363(23), 2211–9.
Add new comment