Business benefits of statistical models
In a recent meeting I was asked by a reinsurer what the advantages were of using statistical models in his business. The reinsurer knew about the greater analytical power of survival models, but he wanted more. One reason I gave is that because survival models are built at the level of the individual, it is often easier to spot data problems which would otherwise be invisible to an actuary using traditional methods.
As it happened, a good example of this cropped up the following week. A pension scheme was looking at the feasibility of a longevity swap. During the quotation process an updated extract of the pensioner data was provided, ostensibly to give an up-to-date picture of the annual pension amounts. A cursory check of the data suggested that this was the only item which had changed. However, the deviance residuals in the fitted survival models suggested otherwise, as shown in Figures 1 and 2:
Figure 1. Deviance residuals v. duration for first pension-scheme data extract.
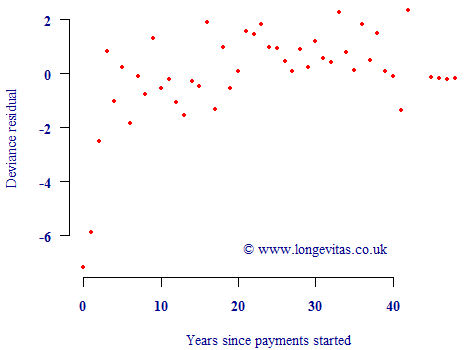
Figure 1 shows a reasonable pattern for the model based on the first extract, with most residuals lying within the interval [-2, +2] apart from some obvious temporary initial selection in the first few years. Now contrast this with the pattern of residuals in Figure 2 for the same model based on the second extract:
Figure 2. Deviance residuals v. duration for second pension-scheme data extract.
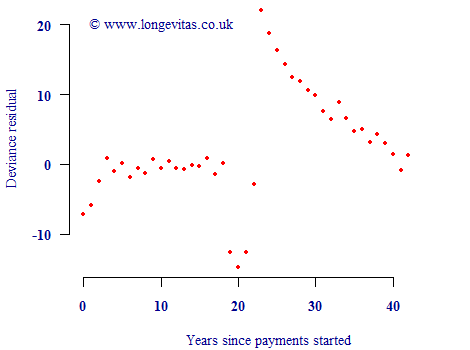
Figure 2 clearly shows that something is wrong with the second extract. The pattern is obviously non-random, and far too many residual values are well outside the acceptable range of [-2, +2]. We also have a clue as to where to start looking: the plots of residuals against age and other variables were fine, so the problem is somehow connected to duration. Closer inspection of the data revealed that some of the records in the second extract had a different commencement date compared to the first extract.
This data problem might never have been picked up by a traditional comparison against a standard table. After all, the pension amounts were being updated, so one would have expected an amounts-weighted standard-table comparison to change. In contrast, the statistical model not only made it easy to plot the residuals, but the standardised scale of the residuals enabled the problem to be quickly spotted.
Add new comment