Features of the survival curve

 The survival curve is simply the proportion of lives surviving to each age.  Below is an example for males at initial age 60 in the United Kingdom, using the Interim Life Table from the Government Actuary's Department:

Survival curve for males in United Kingdom between 2004 and 2006

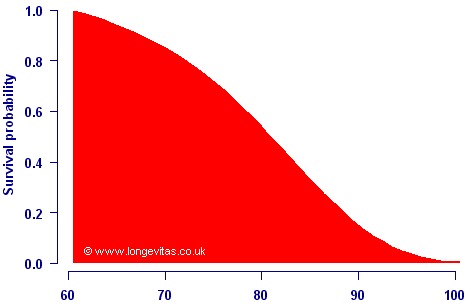
The survival curve starts at 1 (or 100%) as everyone is alive at outset, and decreases monotonically towards zero (or 0%) as people die. The survival curve is better known to actuaries as tpx, the probability of a life aged x surviving to age x+t.  An oft-unappreciated feature of the survival curve is that the area underneath it is simply the life expectancy.

Instead of plotting the survival curve, exactly the same data can be used plot the distribution of age at death:

Distribution of age at death for males in United Kingdom between 2004 and 2006

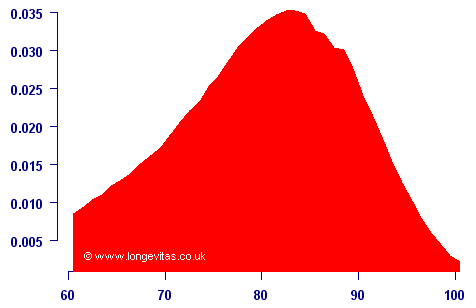
The graph above is known to actuaries as the curve of deaths, and was long ago recognised as often being easier to deal with than mortality rates.

Another way of looking at the curve above is that it is the probability density function for the age at death.  A survival model implicitly assumes that the future lifetime is a random variable, Tx.  The probability density function for Tx is simply tpxμx, which is the curve of deaths plotted above.  Thus, a survival model is the same as assuming that future lifetime is a random variable.  The converse is also true: assuming a probability distribution for the future lifetime is a survival model.

Written by: Stephen Richards
Publication Date:
Last Updated:

Curve plotting in Longevitas

Longevitas users can get all forms of summary curves within any model report by clicking on the Curves tab. Options include the force of mortality, the rate of mortality, the survival curve, the curve of deaths and the Kaplan-Meier curve. 

Previous posts

US Presidential survival

Senators Barack Obama and John McCain are now the confirmed candidates for their respective parties in the forthcoming US presidential election.  Much comment on Senator McCain surrounds his age (72 as at 29th August 2008), against that of Senator Obama (47, as at 4th August 2008).
Tags: Filter information matrix by tag: Barack Obama, Filter information matrix by tag: John McCain

Zip codes

Following a previous entry on postcodes, we have been asked how US zip codes can be used for mortality modelling.
Tags: Filter information matrix by tag: zip code, Filter information matrix by tag: postcodes, Filter information matrix by tag: geodemographics

Add new comment

Restricted HTML

  • Allowed HTML tags: <a href hreflang> <em> <strong> <cite> <blockquote cite> <code> <ul type> <ol start type> <li> <dl> <dt> <dd> <h2 id> <h3 id> <h4 id> <h5 id> <h6 id>
  • Lines and paragraphs break automatically.
  • Web page addresses and email addresses turn into links automatically.