Further reducing uncertainty
In a previous posting I looked at how using a well founded statistical model can improve the accuracy of estimated mortality rates. We saw how the relative uncertainty for the estimate of \(\log \mu_{75.5}\) could be reduced from 20.5% to 3.9% by using a simple two-parameter Gompertz model:
\(\log \mu_x = \alpha + \beta x\qquad (1)\)
to "borrow" information at adjacent ages. In the previous example we used just one year's data, whereas an obvious improvement would be to use the experience over multiple years to boost the data used. Survival models for the force of mortality, \(\mu_x\), can easily be extended to cover multi-year data, although we still occasionally see invalid applications of GLMs for qx in this area.
Using ten years' data for the same model reduced the width of the 95% confidence interval further from 3.9% to 1.3% of the estimate of \(\log\mu_{75.5}\). As expected, we have further reduced uncertainty from using more data, but we can also see that there is a diminishing return to extra data. We have multiplied the volume of data by a factor of around ten, but the width of the confidence interval has only improved by a factor of three. While more data is obviously beneficial, the extra benefit reduces.
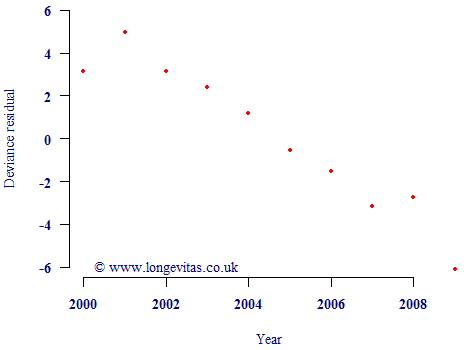
However, this reduction in uncertainty is only valid if the underlying model is valid. One issue is that mortality levels have not been constant in recent decades. In fact, mortality rates have been falling, as evidenced by a plot of the residuals against calendar year in Figure 1. If the simple Gompertz model were valid for multi-year use, the residuals should look like a scatterplot of N(0,1) variates. However, instead there is a very obvious non-random pattern indicating how mortality rates have been broadly falling over time. This partially invalidates the model in Equation (1), and thus means we cannot use the reduced relative uncertainty of 1.3%.
Figure 1. Deviance residuals by calendar year. Source: UK pension-scheme experience data to 2009, covering both males and females.
If we want to use multi-year data, then we need to modify the Gompertz model in equation (1) to allow mortality levels to vary in time. We can do this as follows:
\(\log\mu_{x,y} = \alpha + \beta x + \delta(y-2000)\qquad (2)\)
where the new parameter \(\delta\) allows the level of mortality to change with calendar time \(y\). We offset \(y\) by 2000 to keep the parameters well scaled — the fitted mortality rates and the uncertainty over them are unaffected by this constant.
When fitting the model we get fitted values for the three parameters, together with the matrix of covariances between them. From this we can derive a time-varying estimate of the force of mortality, \(\mu_{x,y}\), and suitable confidence intervals. This time the relative uncertainty over \(\log\mu_{75.5}\) rises from 1.3% under equation (1) to 2.1% of the estimated value under equation (2). This makes sense: the 2.1% relative uncertainty is higher than the 1.3% because Equation (2) has extra uncertainty over the average rate of change in time, as measured by \(\delta\). Equally, both uncertainty figures are lower than the 3.9% for the one-year model in the earlier post because we have brought extra data to bear. However, it is the 2.1% figure from applying equation (2) which we should use if we are estimating current mortality rates, since the validity of the 1.3% figure was undermined by the non-random residuals in Figure 1. This phenomenon of time-varying mortality rates is an important aspect of using multi-year data in assessing mis-estimation risk under Solvency II.
Previous posts
Label without a cause
Parameterising the CMI projection spreadsheet
The CMI is the part of the UK actuarial profession which collates mortality data from UK life offices and pension consultants. Amongst its many outputs is an Excel spreadsheet used for setting deterministic mortality forecasts. This spreadsheet is in widespread use throughout the UK at the time of writing, not least for the published reserves for most insurers and pension schemes.
Add new comment