How much data do you need?
There are two common scenarios when an actuary has to come up with a mortality basis for pensioners or annuitants:
- For a portfolio of liabilities already owned, e.g. an insurer's existing annuities in payment or a pension scheme's pensions in payment.
- For a portfolio of liabilities where the risk is to be transferred, e.g. an insurer or reinsurer looking to price a buy-out or longevity swap.
Leaving aside questions of data quality, in each case the actuary is faced with the same question: is the portfolio's experience data large enough to rely on? And if there isn't enough experience data, what does the actuary do instead?
At one extreme consider a pension scheme with a hundred pensioners. With an average of around two pensioner deaths expected each year, the experience data will have essentially no credibility (we use the word credibility here in its actuarial sense, meaning "how much reliance can be placed on this data?"). Instead the actuary will have to rely on some model of mortality to derive a basis, where this model has been calibrated to a much larger data set which does have credibility. Let us call this larger data set the reference data to distinguish it from the portfolio's own experience. This is the scenario for which our service at mortalityrating.com exists, where the mortality model has been calibrated using the large data set of UK pensioner experience built up by Mercer.
The drawback of using a model calibrated to a different data set is basis risk: if there is some mortality feature of the portfolio which is not captured in the model, or is not present in the reference data used to fit the model, then the resulting mortality basis will be inappropriate. It does not matter how large or credible the reference data set is. Indeed, there is even a danger that the actuary might be blinded by the scale of the reference data relative to the size of the portfolio, to the extent that basis risk is neglected or even forgotten entirely. The starkest example of this I have encountered was a dockworker's pension scheme, where mortality was very heavy due to the high incidence of mesothelioma resulting from historic exposure to asbestos. No reference data can help in the presence of such a specific occupational hazard, regardless of how large that reference data set might be. Few examples of basis risk will be quite this extreme. However, occupational pension schemes are, by their very definition, a concentration of lives sharing similar occupational histories and thus sharing exposure to the same occupational hazards. Pension-scheme actuaries therefore exercise judgement when using third-party rating tools, as they may know of scheme-specific mortality features that such tools cannot be expected to account for.
But what about the other end of the spectrum — if a portfolio does have credible experience data, at what point does the data become fully credible on it own? In other words, when does a third-party reference data set simply become unnecessary? Or worse: at what point does the use of the third-party data actually just add unnecessary basis risk? To explore this we can create artificial portfolios of varying sizes with known mortality characteristics as follows:
- 90% of lives with an annual pension of £3,000 p.a., each life following a Gompertz law of mortality with \(\alpha=-10\) and \(\beta=0.1\).
- 10% of lives with an annual pension of £30,000 p.a., each life following a Gompertz law of mortality with \(\alpha=-12\) and \(\beta=0.12\).
The above profile leads to a low-mortality group of 10% of lives having 52.6% of all benefits, a concentration of liabilities quite common in pension schemes and annuity portfolios; see the examples in Richards (2008) and Richards & Currie (2009). For a given population size, \(n\), we can then do the following:
- Simulate five years of mortality experience for a population split as described above.
- Use this "experience" to estimate the Gompertz parameters, \(\alpha\) and \(\beta\), separately for both sub-groups.
- Value the liabilities to the survivors using the estimated parameters.
- Value the liabilities to the survivors using the known underlying parameters.
- Compare the ratio of (3) and (4) to see how close the liabilities are.
The above procedure can be repeated for various population sizes to see how the scale of the experience data impacts on the accuracy of the liability estimate. This is done in Figure 1, which shows the ratio of the estimated liability value to the known underlying liability value for various amounts of experience data (we use the number of deaths on the x-axis as a convenient metric for the amount of experience data available).
Figure 1. Ratio of estimated liability using mortality experience to expected liability using known underlying parameters. Five years of simulated experience according to the population structure above. Net discount rate 0%. 100 simulations for each population size.
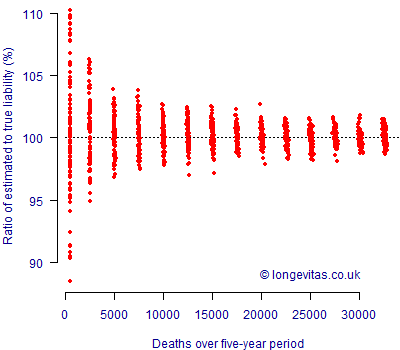
Figure 1 shows what one would broadly expect: uncertainty is relatively large with fewer than 1,000 deaths, but shrinks as the available experience data grows. Also as we would expect, the benefit of further data reduces in a non-linear fashion: ever-more data is required to make ever-smaller reductions in uncertainty. Intriguingly, the benefit of additional data seems very small above 20,000 deaths. Visually, from this experiment we might conclude that the mortality experience of a portfolio with this structure of concentration risk and mortality is fully credible at 20,000 deaths.
Of course, a real-world data set would offer more risk factors than in this simple example: gender for a start, and possibly also retirement status (first life v. dependent) or even postcode-driven lifestyle. In a real-world scenario one would likely fit a more sophisticated model than the Gompertz law of mortality, and the pension-size structure would also likely be different. We have also assumed that there are no time trends, which is seldom the case in practice. However, this simple example suggests that full credibility can be achieved with an amount of experience data available to many annuity portfolios and some large pension schemes.
References:
Richards, S. J. (2008) Applying survival models to pensioner mortality data, British Actuarial Journal, 14(II), 257–326 (with discussion).
Richards, S. J. and Currie, I. D. (2009) Longevity risk and annuity pricing with the Lee-Carter model, British Actuarial Journal, 15(II) No. 65, 317–365 (with discussion).
Add new comment