Mortality and pension size
It will surprise nobody reading this blog that richer people tend to live longer. This applies both between countries (countries with a higher per capita income tend to have higher life expectancies) and also within countries (people of higher socio-economic status tend to live longer than others, even when they all share the same comprehensive healthcare system).
Historically actuaries allowed for this in mortality analysis through weighting their calculations by benefit size, rather than just by headcount. For example, consider the following statistic, \(Y\), which is derived from equations (8.1) and (8.2) in Macdonald et al (2018); \(Y\) is the difference between the lives- and amounts-weighted comparisons against a reference mortality table:
\[Y=\displaystyle\frac{\displaystyle\sum_x d_x}{\displaystyle\sum_x E^c_x\mu_{x+1/2}} - \displaystyle\frac{\displaystyle\sum_x d_x w_x}{\displaystyle\sum_x E^c_x\mu_{x+1/2} w_x}\qquad(1)\]
where summation is over single years of age \(x\), \(d_x\) is the number of deaths aged \(x\) last birthday, \(E^c_x\) is the central rate of exposure time between age \(x\) and \(x+1\) and \(w_x\) is total pension payable to lives aged \(x\). \(\mu_x\) is the mortality hazard according to some reference basis, e.g. a published table. The choice of reference table is largely unimportant as long as the same table is used in both fractions in equation (1). Table 1 shows the value of \(Y\) for males and females for several international portfolios, using the CMI table S2PA as a reference.
Table 1. Reduction in mortality due to weighting by pension size as per equation (1). Source: Richards (2020).
| Country | Portfolio nature | Males | Females |
|---|---|---|---|
| Canada | Pension plan | 4.5% | 4.4% |
| Germany | Various pension plans | 8.5% | 1.7% |
| England | Pension scheme | 18.1% | 7.7% |
| France | Insured annuities | 3.7% | 2.7% |
| Netherlands | Pension scheme | 15.2% | 10.0% |
| USA | Pension plan | 3.1% | 3.2% |
| South Africa | Various pension plans | 32.4% | 22.7% |
Table 1 shows that amounts-weighted mortality is consistently lower than lives-weighted mortality, with portfolios like the South African one exhibiting truly dramatic differences. However, a drawback with the traditional actuarial approach in equation (1), and thus the figures in Table 1, is that no indication is given of statistical significance.
One way to approach the question of statistical significance is to fit a model allowing for age and gender, then plot the residuals by size-band. To create the size-bands we sort the pensions within each portfolio, then define break-points such that equal numbers of lives fall into each band (or as close to equal as we can achieve). We can then calculate deviance residuals based on the number of actual and modelled deaths in each size-band. If the residuals look like independent N(0,1) variates, then there is no link between pension size and mortality. However, if the residuals do not look like i.i.d. N(0,1), either because of correlation or too many values lying far outside ±1.96, then this would be evidence of a link between pension size and mortality. Figure 1 shows the results for the same portfolios in Table 1.
Figure 1. Deviance residuals from model allowing for mortality by age and gender. The downward drift from left to right shows that higher-income pensioners have lower mortality rates. Source: Richards (2020).
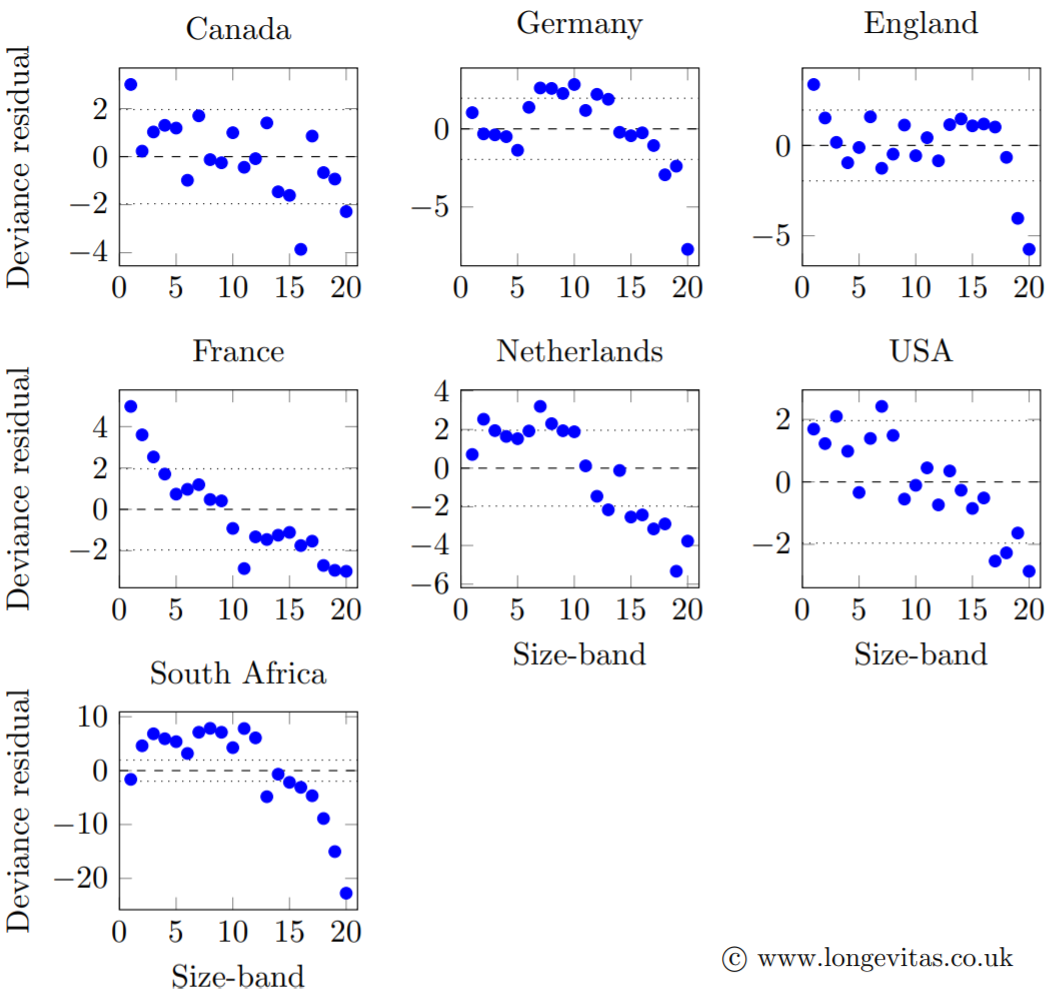
As is often the case, the statistical models behind Figure 1 are more informative than the traditional actuarial A/E comparisons in Table 1. For example, although the differences in Table 1 are larger for the Canadian portfolio than the French one, Figure 1 shows that there is a more pronounced gradient of mortality by pension size-band for the French annuities. In the case of the English portfolio, the strongest difference is between the top two vigintiles (i.e. the top decile) and the rest. This reflects the fact that pension size has a mixed ability to act as a proxy for socio-economic differentials: on the one hand, having a really large pension is an unambiguous signal that the pensioner is wealthy; however, lower pension amounts cannot distinguish between the poor (for whom the pension is all they have after a lifetime of service) and short-service, high-salary individuals (for whom the pension is just part of their retirement income). To combat this weakness of pension size as a mortality predictor, UK actuaries typically augment their models with geodemographic profiles.
References:
Macdonald, A. S., Richards. S. J. and Currie, I. D. (2018). Modelling Mortality with Actuarial Applications, Cambridge University Press, Cambridge.
Richards, S. J. (2020) Modelling mortality by continuous benefit amount, Longevitas working paper.
Add new comment