S2 mortality tables
The CMI has released the long-awaited S2 series of mortality tables based on pension-scheme data. These are the first new tables since the CMI changed its status (the S2 series is only available to paying subscribers, unlike prior CMI tables). A comparison of the main S2 mortality rates with the preceding S1 rates is given in Figure 1.
Figure 1. Ratio of S2 mortality rates to S1 rates. Source: Own calculations using S1PA and S2PA tables from the CMI.
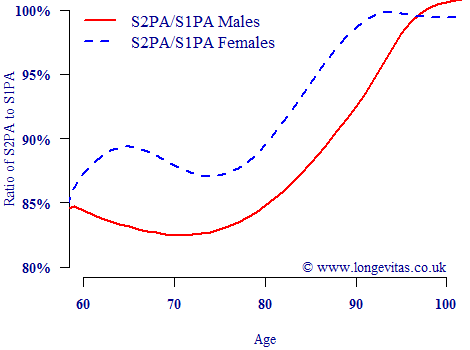
As expected, there have been large reductions in mortality, especially for males — at ages 60–80 there has been a fall of at least 15%. This age range is key for pension-scheme reserves and annuity profitability. The S1 series has an effective date of 1st September 2002, while the new S2 series has an effective date of 1st January 2007. We can use these dates to work out the implied annual improvement rates between the two series, as done in Figure 2.
Figure 2. Implied annual improvement rates between S1 and S2 mortality tables. Source: Own calculations using S1PA and S2PA tables from the CMI.
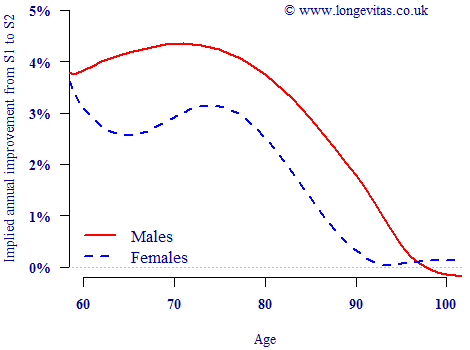
Some details of the data will have been lost during the table-graduation process. There have also been some changes in the weightings of contributing industries between the two series, as documented in CMI's Working Paper 71. Nevertheless, with these caveats in mind Figure 2 shows that implied mortality improvements amongst males have exceeded 4% per annum for ages 63–77. Of no less import is the fact that implied improvements for males were above 2% per annum up to age 89. The development of improvements at these advanced ages is directly relevant to the assumptions underlying targeting models, such as the CMI's own projection model.
Whilst such changes in published tables are informative, insurers are more interested in the mortality improvements in their own liabilities. Modern risk management increasingly involves building a bespoke model of your portfolio's characteristics and experience. This allows not only the inclusion of risk factors which are specific to the business, but also the investigation of portfolio-specific mortality improvements. An illustration of this was given by Richards, Kaufhold and Rosenbusch (2013) for a portfolio of German pensioners, where seven risk factors were identified in addition to a time trend. Portfolio-specific analysis is therefore doubly useful: it not only avoids basis risk by being directly relevant to your liabilities, it also allows you to measure the actual improvements.
References:
CMI Ltd (2014) Graduations of the CMI SAPS 2004–2011 mortality experience based on data collected by 30 June 2012 — Final “S2” Series of Mortality Tables, ISSN 2044–3145.
Richards, S. J., Kaufhold, K. and Rosenbusch, S. (2013) Creating portfolio-specific mortality tables: a case study, European Actuarial Journal 3(2), 295–319.
Add new comment