Trend risk and age
There are several ways of looking at longevity trend risk, as covered in our recent seminar. However, regardless of how you choose to look at this risk, there are some pitfalls to watch out for. By way of illustration, we will consider here the capital requirements under the stressed-trend approach to longevity risk, although the basic points apply to most approaches.
Figure 1 shows the capital requirements implied by stressing the longevity trend over the lifetime of the annuitant. This is the so-called run-off approach, as opposed to the one-year, value-at-risk approach required by Solvency II (or ICA in the United Kingdom). The first aspect of Figure 1 is how different the various capital requirements are for the different models. For example, at age 70 the Age-Period-Cohort (APC) model suggests holding only around two-thirds of the capital suggested by the CBD model. This illustrates the importance of considering model risk in all aspects of reserving and capital work. Since it is impossible to say for sure which model is correct, it is important not to base one's capital requirements on a single model. A regulator will want to see evidence that an insurer is capable of working with more than one projection model, not least to ensure that a model wasn't picked solely for its ability to produce the lowest capital requirements!
Figure 1. Stressed-trend capital requirements by age for various stochastic projection models fitted to data for males in England & Wales between 1961 and 2010 (ages 50–104). Ratio of temporary annuity factors from given age to age 105, discounted at 3% per annum. Source: Richards, Currie and Ritchie (2012).
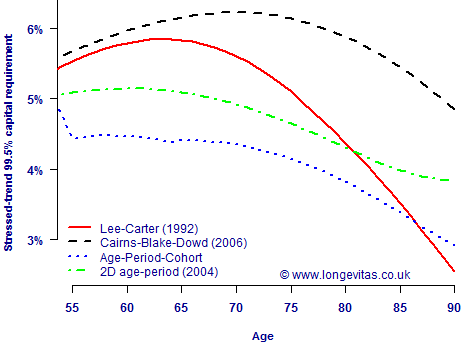
The other interesting aspect of Figure 1 is how the capital requirements vary by age. The most dramatic example of this is given by the Lee-Carter model, which produces a relatively high capital requirement up to age 65, but where the capital requirement falls steeply from age 75. This complicates the judgement on the model risk mentioned above: not only do some models produce higher capital requirements than others, but the relationship between the various models depends on the age at outset. It is therefore important not just to compare annuity factors at a specimen age, say age 65, but to calculate values at ages relevant to the portfolio concerned. As Figure 1 shows, a model may be prudent at one age but much less so at another.
References:
Cairns, A. J. G., Blake, D. and Dowd, K. (2006). A two-factor model for stochastic mortality with parameter uncertainty: theory and calibration. Journal of Risk and Insurance, 73, 687–718
Currie, I. D., Durban, M. and Eilers, P. H. C. (2004). Smoothing and forecasting mortality rates. Statistical Modelling, 4, 279–298
Lee, R. D. and Carter, L. (1992). Modeling and forecasting the time series of US mortality. Journal of the American Statistical Association, 87, 659–671
Richards, S. J., Currie, I. D. and Ritchie, G. P. (2012). A value-at-risk framework for longevity trend risk. Longevitas Ltd
Add new comment