Weighing the evidence
We've previously discussed the significant challenges involved in forecasting mortality by cause of death. Needless to say it isn't any easier to predict the impact of trends in lifestyle factors that drive those causes. One example is the research actvity around rising obesity, and specifically around the possibility rising obesity may negate the improvements in smoking-related mortality. Sturm and Wells (2000) asserted that obesity had a significantly higher impact on health outcomes than lifetime smoking or poverty. They reasserted these conclusions in 2002. It is clear that in both the US and UK we do see a diminishing prevalence of smoking allied with surging increases in obesity, but working out the net consequence of this is non-trivial. Another group of mortality researchers who considered this problem in the context of US population data in 2005 had this to say:
"We anticipate that as a result of the substantial rise in the prevalence of obesity and its life-shortening complications such as diabetes, life expectancy at birth and at older ages could level off or even decline within the first half of this century."
A Potential Decline in Life Expectancy in the United States in the 21st Century (New England Journal Of Medicine - 2005)
This paper goes on to suggest we could see children living shorter lives than their parents, an idea that circulates freely in the media to this day. Expert evidence was clearly accumulating at this time but we've previously seen that sole-reliance on expert opinion can be misleading. It is therefore worthwhile to objectively consider what has happened to mortality in the recent past in light of some of these predictions. One reasonable way to approach this is this as part of a backtest. Figure 1 compares the best-estimate mortality forecast as at 2000 with observed mortality to 2010. The red points plot the actual/observed rates, whilst the grey line is the best estimate forecast by the model for the given age.
Figure 1: Best estimate log mortality forecast plus observed mortality to 2010 for selected ages from a Lee-Carter smooth alpha and beta arima (1,1,1) projection. Mortality data from USA (mortality.org) for years 1970-2000, ages 30-100.
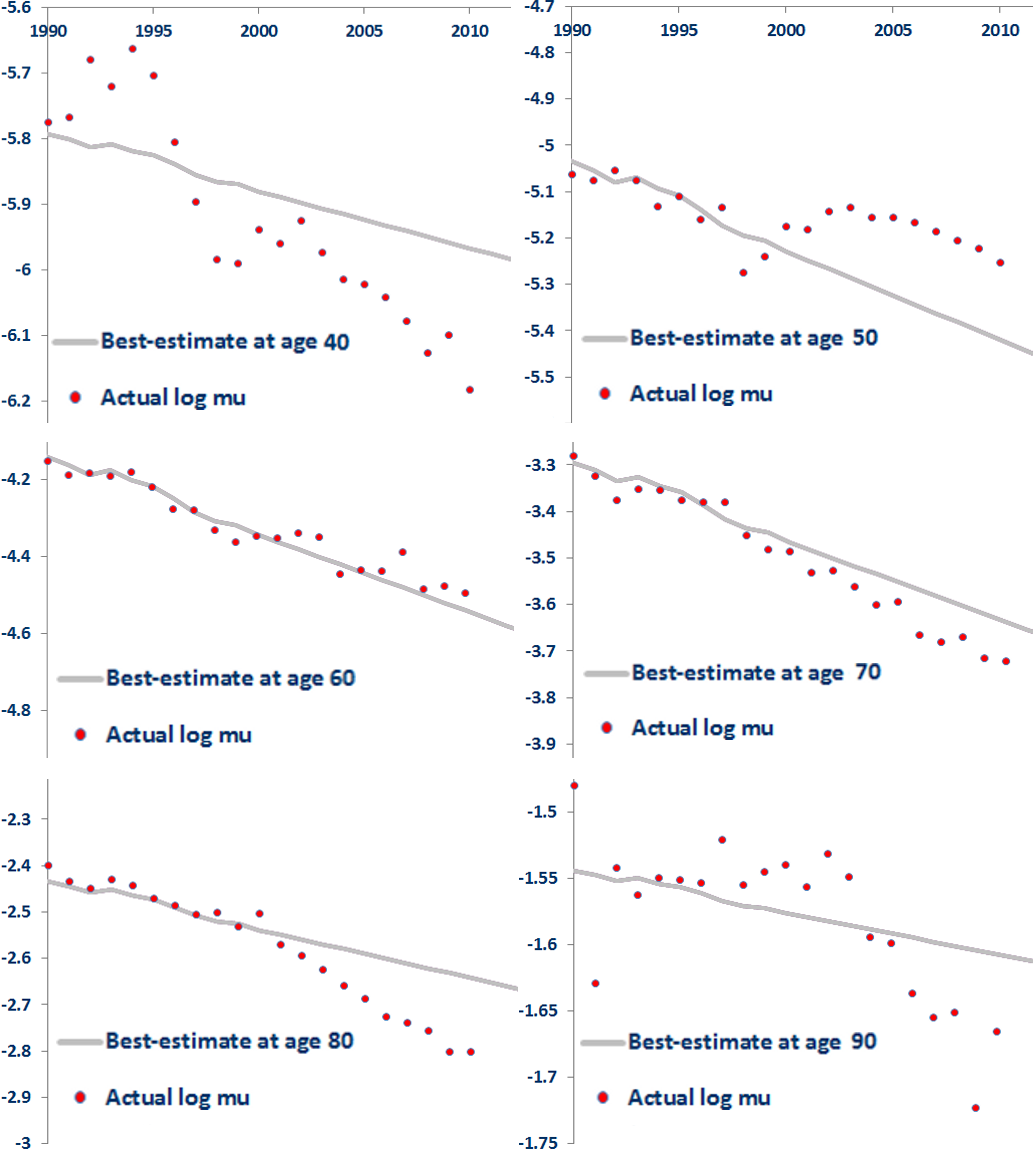
What this projection demonstrates is that mortality improvements continued for all ages between 2000 and 2010, and outstripped the best-estimate forecast at many ages considered. This is consistent with the results of a more recent review into obesity trends:
"Increasing levels of obesity over recent decades have been expected to lead to an epidemic of diabetes and a subsequent reduction in life expectancy, but instead all-cause and cardiovascular-specific mortality rates have decreased steadily in most developed countries and life expectancy has increased."
Obesity and Trends in Life Expectancy (Journal of Obesity - 2012)
Obesity is doubtless having a very real impact, but one that now appears more complex than presumed in the early years of the millenium. While expert insight is undoubtedly valuable, expectations and predictions are always vulnerable to incomplete knowledge and unstated biases. This is why it is a good idea to apply stochastic projections using all-cause mortality to benchmark any basis informed by expert opinion.
Add new comment