Discounting longevity trend risk
Establishing the capital requirement for longevity trend risk is a thorny problem for insurers with substantial pension or annuity payments. In a previous posting I looked at the link between capital requirement and age, as well as the importance of model risk. However, another important factor is the discounting function used for future cashflows. This is illustrated in Figure 1, which shows the capital requirements implied by stressing the longevity trend over the lifetime of the annuitant. This is done for the same projection model at various discount rates. Besides the pattern with age, the most obvious feature is the strong dependence of the capital requirement on the discount rate used.
Figure 1. Stressed-trend capital requirement by age for Lee-Carter ARIMA(3,1,3) projection model fitted to data for males in England & Wales between 1961 and 2010 (ages 50–104). Ratio of temporary annuity factors from given age to 105, discounted at various interest rates per annum. Source: Richards, Currie and Ritchie (2012).
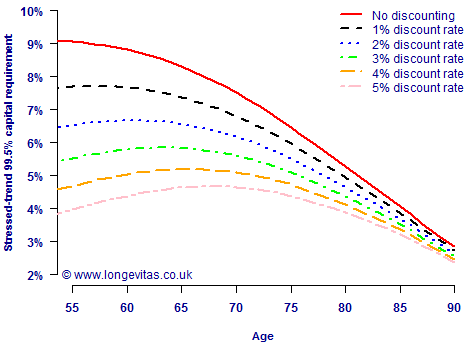
Figure 1 also shows why there is such consternation about the idea of extending Solvency II to pension schemes. Many annuity portfolios in the UK contain predominantly level (non-escalating) annuities, so the longevity trend-risk capital they would hold might follow the 3% discount curve at the time or writing (additional capital has to be held for other risks). However, defined-benefit pension schemes in the United Kingdom have a statutory obligation to provide pension increases which are linked to inflation (but capped at a maximum rate per annum). The result of this escalation in benefits would be to reduce the effective net discount rate to something like the 1% discount curve in Figure 1. This would mean a pension scheme would have to hold more longevity risk capital if something like Solvency II were to apply — an extra fifth of longevity-risk capital at age 70 if the net discount rate fell from 3% to 1% per annum.
However, a constant interest rate is most definitely not what is implied by modern yield curves. This has implications for valuing annuity cashflows, and therefore for calculating capital requirements for Solvency II. Figure 2 shows the pattern of capital requirements by age when using the UK gilt yield curve from late April 2012.
Figure 2. Stressed-trend capital requirement by age for Lee-Carter ARIMA(3,1,3) projection model fitted to data for males in England & Wales between 1961 and 2010 (ages 50–104). Ratio of temporary annuity factors from given age to 105, discounted at various interest rates and UK gilt-yield curve from late April 2012. Source: Richards, Currie and Ritchie (2012).
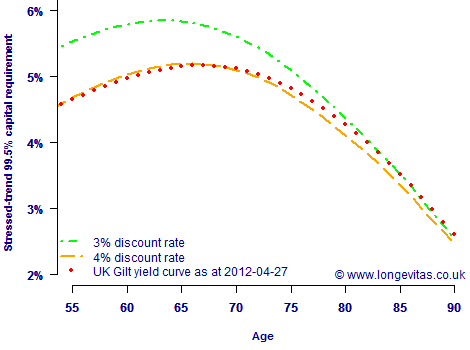
The interesting feature of Figure 2 is how the stressed-trend capital requirement interacts not only with age, but also with the shape of the yield curve. The capital requirements are above the 4% discount curve for ages over 70, but actually below the 4% discount curve between ages 55 and 65. We can see in Figure 2 that it is not sufficient to somehow assume an equivalent constant interest rate for calculating this kind of capital requirement. The interaction between cashflow timing and discount function produces a shape of capital requirement which will be very portfolio-specific, and which will change regularly with the yield curve.
We previously saw the importance of the choice of a representative age for the portfolio concerned, and we also know the critical importance of considering multiple models. Figure 2 here reminds us how important it is to use the right discount function.
References:
Lee, R. D. and Carter, L. (1992). Modeling and forecasting the time series of US mortality. Journal of the American Statistical Association, 87, 659–671. Richards, S. J., Currie, I. D. and Ritchie, G. P. (2012). A value-at-risk framework for longevity tr
Add new comment