Doing our homework
In Richards et al (2013) we described how actuaries can create mortality tables derived from a portfolio's own experience, rather than relying on tables published elsewhere. There are good reasons why actuaries need to be able to do this, and we came across a stark reminder of this while writing Richards & Macdonald (2025).
We start with an illustration of two alternative mortality tables: (a) the freely available National Life Table (NLT), and (b) the proprietary S4PA table from the CMI. The survival curves from age 60 are shown in Figure 1 below. The NLT covers the entire UK population, while S4PA covers just members of occupational pension schemes. Clearly S4PA would be most suitable for actuarial work for pensioners, although Figure 1 shows that these two tables share the same basic shape and other characteristics. Indeed, with minor modifications for mortality level, one could easily substitute one table for the other for most practical purposes.
Figure 1. Survival curves from age 60 using standard mortality tables. Median survival ages are marked in grey. Source: own calculations using UK National Life Table for 2017-2019 and S4PA table from the CMI.
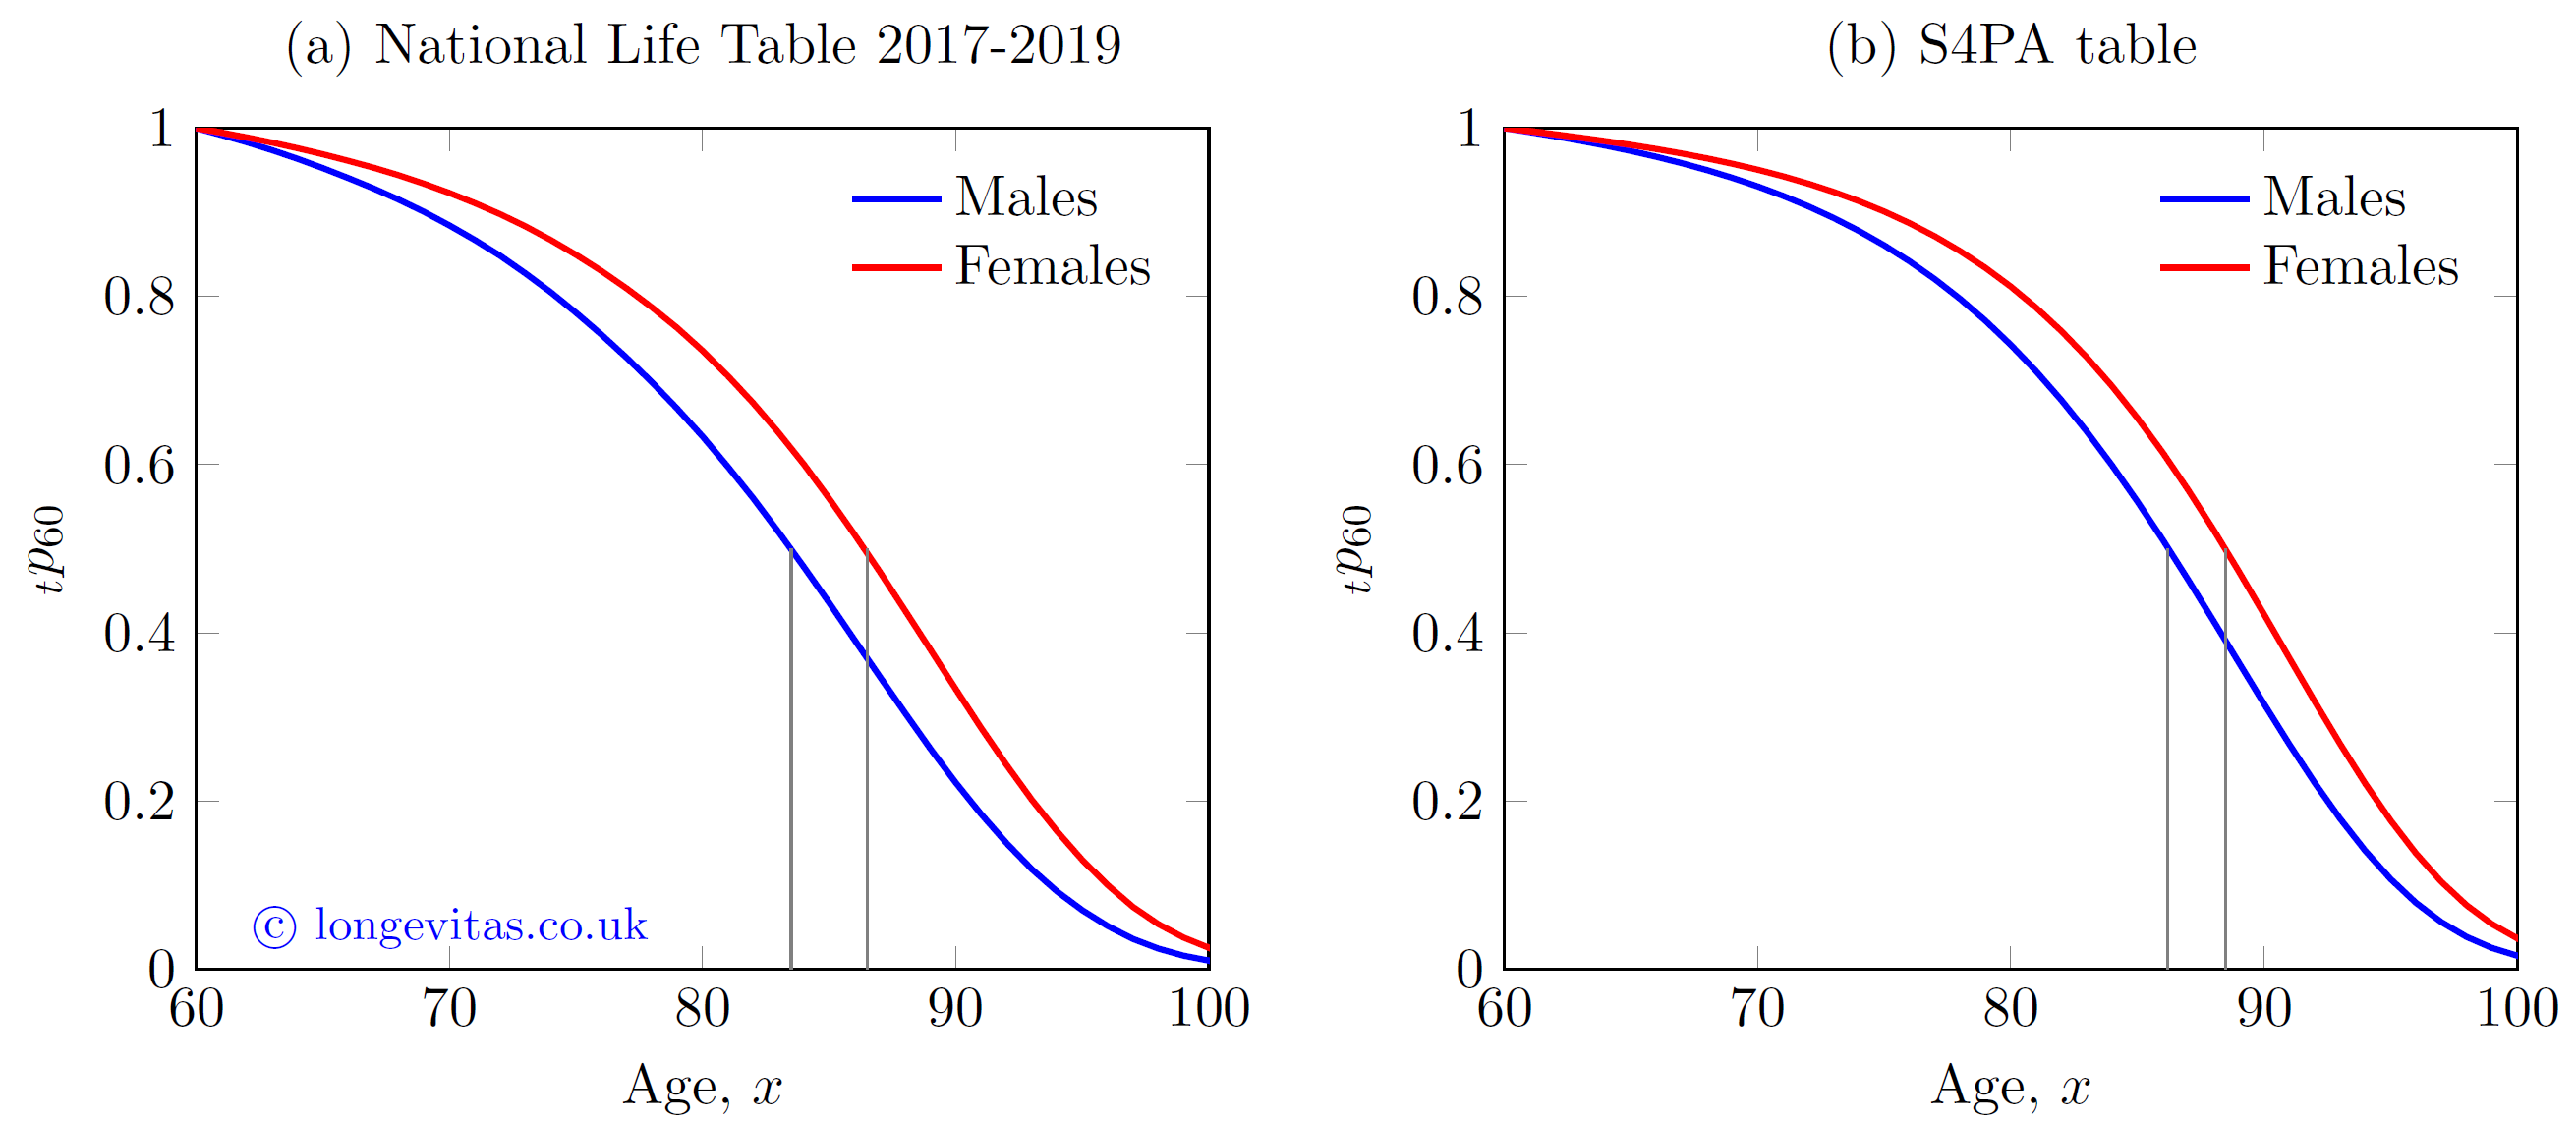
One of many shared features in Figure 1 relates to the median survival age. This is the age to which exactly half of all 60-year-olds survive, i.e. the point where \({}_tp_{60}=0.5\) (these ages are marked in grey on Figure 1). The median survival ages are different under the two tables, but the gap between males and females is around three years in both cases. Now contrast this with Figure 2, which shows the survival curves based on the mortality experience of a portfolio of home-reversion plans:
Figure 2. Kaplan-Meier survival curves for portfolio of home-reversion plans. Source: Richards & Macdonald (2025).
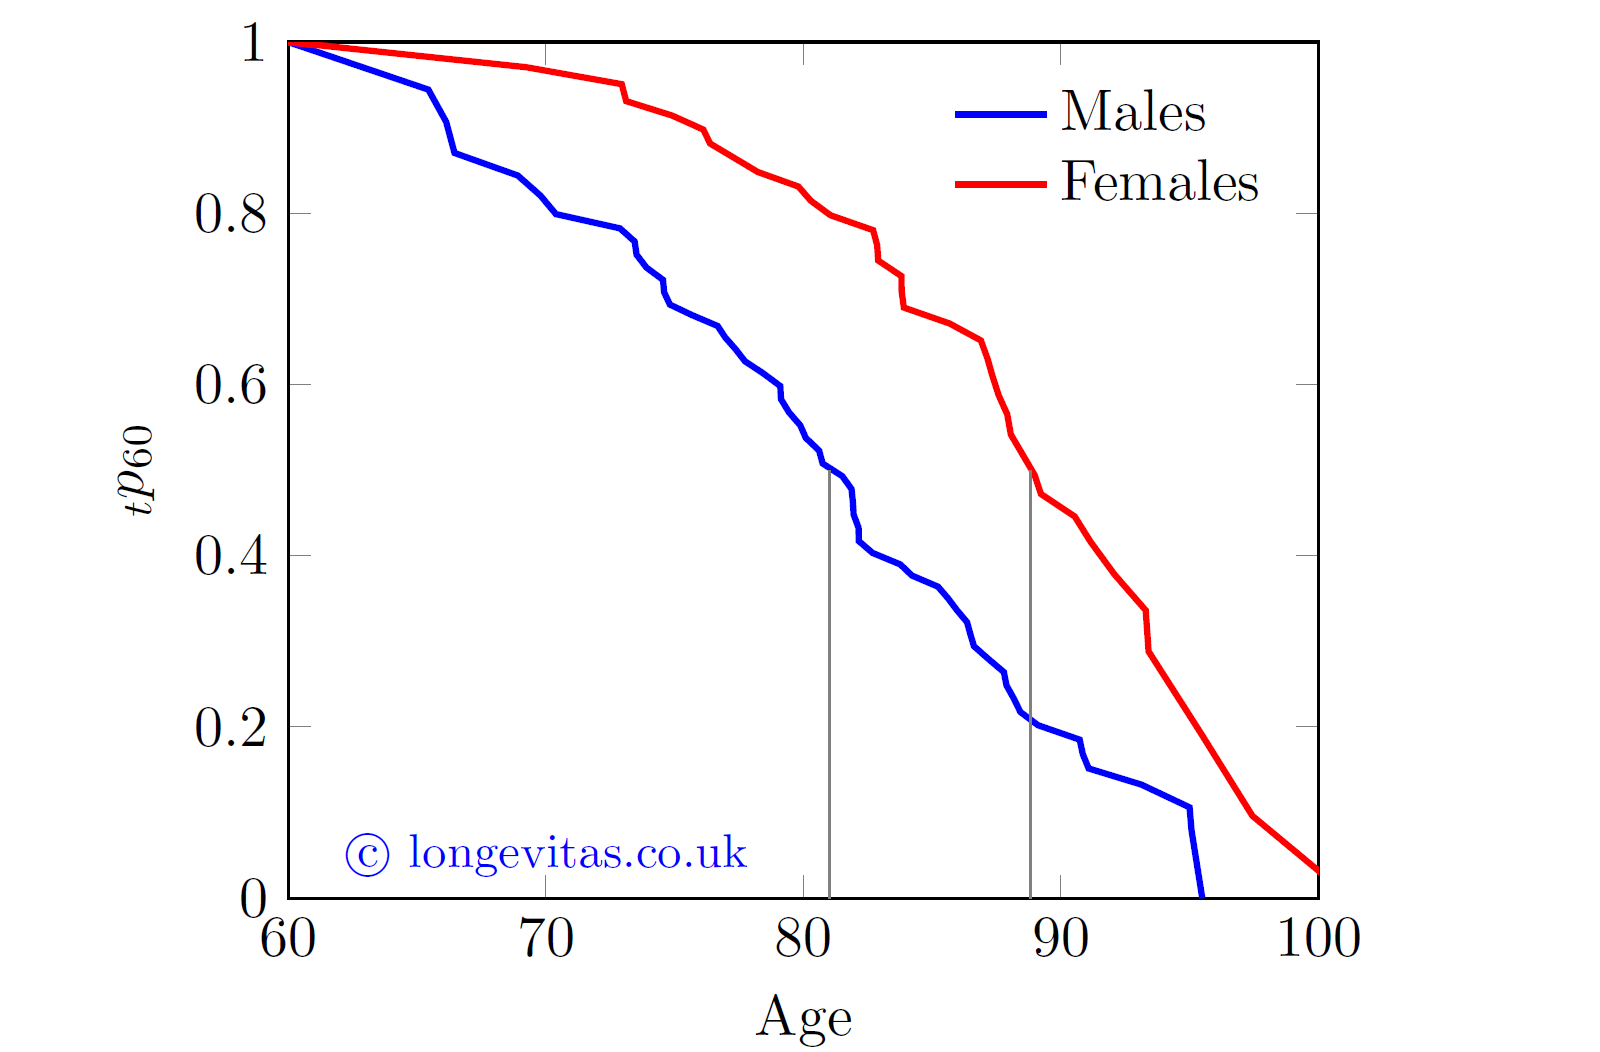
The survival curves in Figure 2 are crinkly because the portfolio is small and there is some random variation visible. Nevertheless, it is clear that the mortality of the home-reversion portfolio is radically different from Figure 1. In particular, the gap in median survival age between males and females is eight years. It is clearly far more appropriate for the portfolio to use its own mortality model, rather than trying to adjust one of the tables in Figure 1. This isn't a unique feature of this data set, as another home-reversion portfolio we looked at also had a very large gap for the median survival age. Standard mortality tables are therefore not the best tools for home-reversion business, so actuaries need the ability to create their own models.
References:
Richards, S. J., Kaufhold, K. and Rosenbusch, S. (2013) Creating portfolio-specific mortality tables: a case study, European Actuarial Journal, 3, pages 295–319, doi: 10.1007/s13385-013-0076-6
Richards, S. J. and Macdonald, A. S. (2025) On Contemporary Mortality Models for Actuarial Use I: Practice, British Actuarial Journal, 30, e18, doi:10.1017/S1357321725000121
Multiple-decrement modelling in Longevitas
Longevitas survival-modelling comes with multiple-decrement modelling as standard. This allows the fast analysis of different demographic risks that compete against each other, such as mortality and long-term care-inception rates for home-reversion plans.
Add new comment