Testing Times (version 2.8.7)
Manual testing is underway on our upcoming releases version 2.8.7 for both Longevitas and the Projections Toolkit. Although they are two separate services, from a technical perspective they share many underlying components, so we move them forward in lockstep with the same version numbers applying to each. I'll cover a small number of the main features in this post, although as usual the release will contain a number of smaller changes as well.
The first thing we have coming is, although technically substantial, something that won't impact all clients. Our 2.8.7 version introduces support for SAML-based single-sign-on (SSO). This means some clients who previously used our existing sign-on/user login mechanisms will be able to switch to a newly implemented SSO login page that redirects to their own in-house identity provider. Since this is an area with lots of devil in the details, we are testing using a third-party framework from Okta to ensure we get those details exactly right.
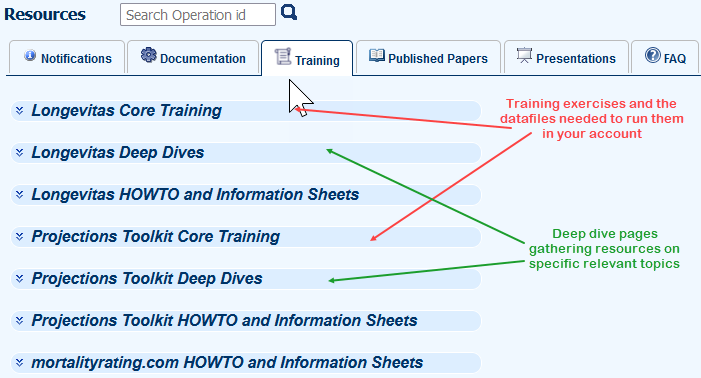
The next change is something more users will notice. When we first started Longevitas, there were no permissive licenses allowing us to bundle real population data with our services. That changed with the UK Government's OGL license, and for a while we've been meaning to exploit that. Well, in this release we've created a Training tab that bundles data and walk-through training notes for our core services. As well as using the UK government population data for the Projections Toolkit, we've updated our own simulated data for Longevitas. The idea is that our users can run these exercises at any time and we can provide training support for any questions via the helpdesk. You can see the new training tab as captured on one of our Testing servers below:
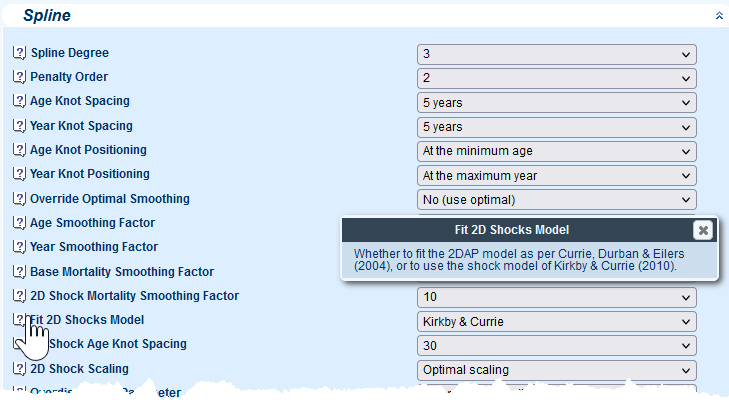
In the Projections Toolkit we have two new models. The first is a smoothed version of the Cairns-Blake-Dowd M9 model. The second is probably more significant at the present time: a robustified version of the 2D Age-Period penalty projection model. In 2009, Iain Currie wrote a blog on the challenges of handling mortality shocks, such as those found in the 1918 Spanish Influenza data. Shortly afterwards Iain went on to publish research with James Kirkby demonstrating how this might be done in the 2D Age-Period model. Following the COVID-19 pandemic, Stephen picked up that research and implemented the changes we needed to offer robustified 2D Age-Period in the Projections Toolkit. This new model is controlled by new Projections configuration in the Spline area as shown below:
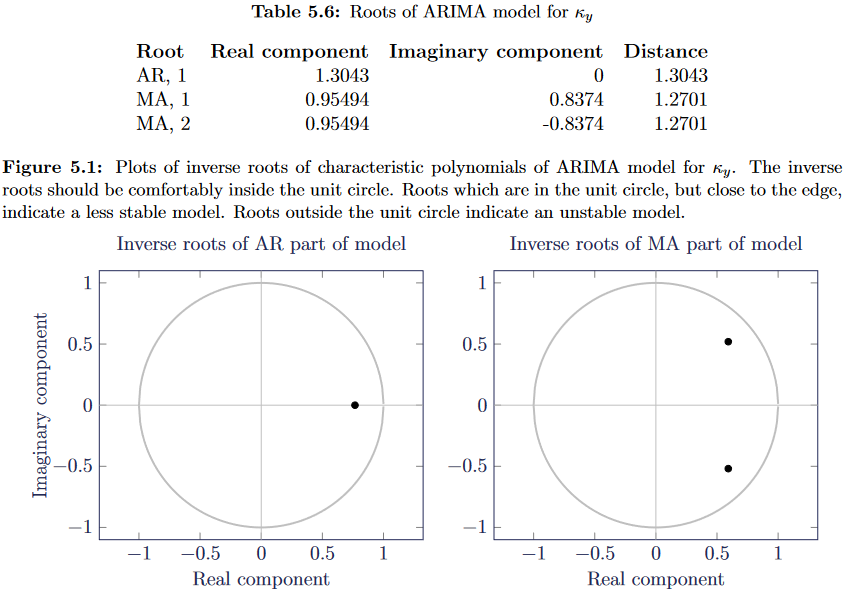
One final thing on the Projections Toolkit. In response to client request we've added a new plot to the PDF report for ARIMA forecasting models for kappa. This plot shows the inverse roots of the characteristic polynomials of the autoregressive (AR) and moving-average (MA) parts of the ARIMA model. Here is how it looks for one of our Lee-Carter projections in testing:
Obviously there are a number of other changes, fixes and handling improvements, but I don't want to outstay my welcome! If you have any questions about any of the features discussed above, don't hesitate to reach out to us via the helpdesk. Hopefully it won't be too long before they escape the testing lab and you see them for yourselves!
Add new comment