Here is the nowcast
Everyone is familiar with the idea of a forecast. You have data on a phenomenon up to the current time, and want to forecast the phenomenon at some point in the future. The most obvious example is the weather forecast, but forecasting is also required in pension and annuity work. For example, when calculating reserves for pension payments, some kind of projection is required for future mortality improvements.
However, there are many situations where the phenomenon of interest is not known at the current time, but will be after a time lag. Examples are Gross Domestic Product (GDP) and inflation statistics, which only become available a few months after the time point they refer to. This is a problem for central banks, since they want to set monetary policy based on today's economy, not the economy of a few months ago. This issue is so pressing that economists developed nowcasting: using data that are available in real time to forecast current and recent levels of economic activity in advance of the formal figures becoming available; see Bańbura et al (2013). Nowcasting of economic data is undertaken by many central banks, such as the Federal Reserve Bank of New York.
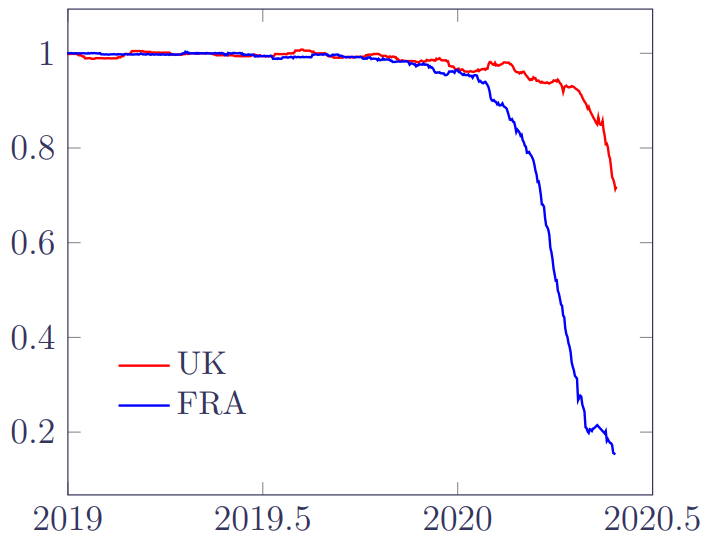
The idea of a delay in complete information is also familiar to actuaries. The classic example is incurred-but-not-reported (IBNR) claims in general insurance. However, there are other examples, including delays in the reporting of deaths of pensioners and annuitants. Since the term IBNR typically refers to aggregate claim costs, we follow Lawless (1994) in referring to occurred-but-not-reported events as OBNR. Figure 1 shows the very different impact of OBNR deaths for two annuity portfolios in France and the UK:
Figure 1. Proportion of mortality hazard reported for two portfolios in France and the UK. The lines show the ratio of the semi-parametric portfolio mortality hazard using a data extract from June 2020 to the same estimate calculated using the September 2020 extract. Source: Richards (2021, Figure 7).
In Richards (2021) I looked at calibrating a model for such OBNR deaths from a single data extract. The idea is that the OBNR-affected mortality hazard at any point in time, \(\mu^{OBNR}_{x+t,y+t}\), is a proportion \(\rho(u_1-y-t)\) of actual mortality, \(\mu^*_{x+t,y+t}\):
\[\mu^{OBNR}_{x+t,y+t} = \mu^*_{x+t,y+t}\rho(u_1-y-t)\qquad(1)\]
The function \(\rho\in[0,1)\) represents the proportion of deaths reported at a point in time, with the function value decreasing monotonically from 1 towards zero as \(y+t\) approaches the extract date, \(u_1\). \(\rho\) will look like a smoothed version of one of the curves in Figure 1.
In my previous blog the function \(\rho\) was regarded as a nuisance parameter — we normally use equation (1) because we observe \(\mu^{OBNR}\), but are actually interested in \(\mu^*\). However, \(\rho\) can also be used to create a nowcast of mortality, i.e. an estimate of current and recent mortality levels that would otherwise not be known for several months. Such a nowcast is useful for staffing service areas.
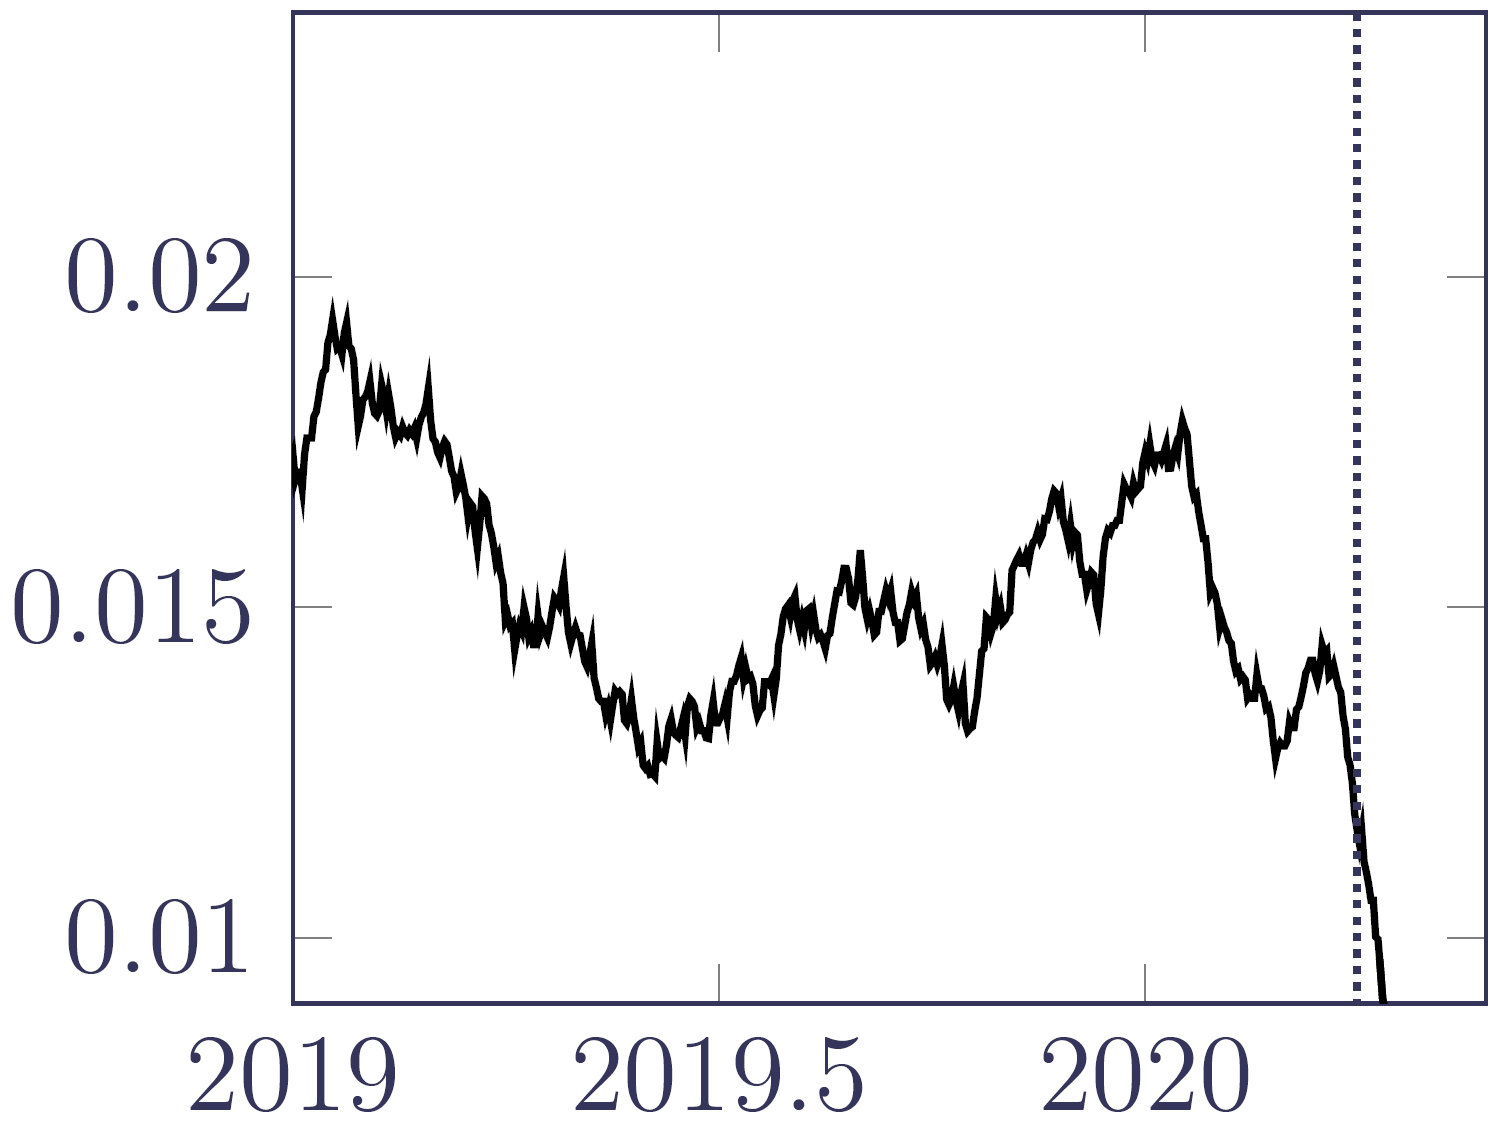
We start by considering the semi-parametric estimator of the portfolio hazard, \(\hat\mu_{y+t}\), as defined in an earlier blog. This is shown for the French annuitants in Figure 2, where the drop in mortality levels due to unreported deaths is evident on the right. At the time of the data extract in June 2020 there was no sign of the first COVID-19 shock in April 2020, for example.
Figure 2. \(\hat\mu_{y+t}\) using a data extract from June 2020, showing the impact of reporting delays on the right as \(y+t\) approaches the extract date. The dotted vertical line marks 1st April 2020. Source: Richards (2021, Figure 13a).
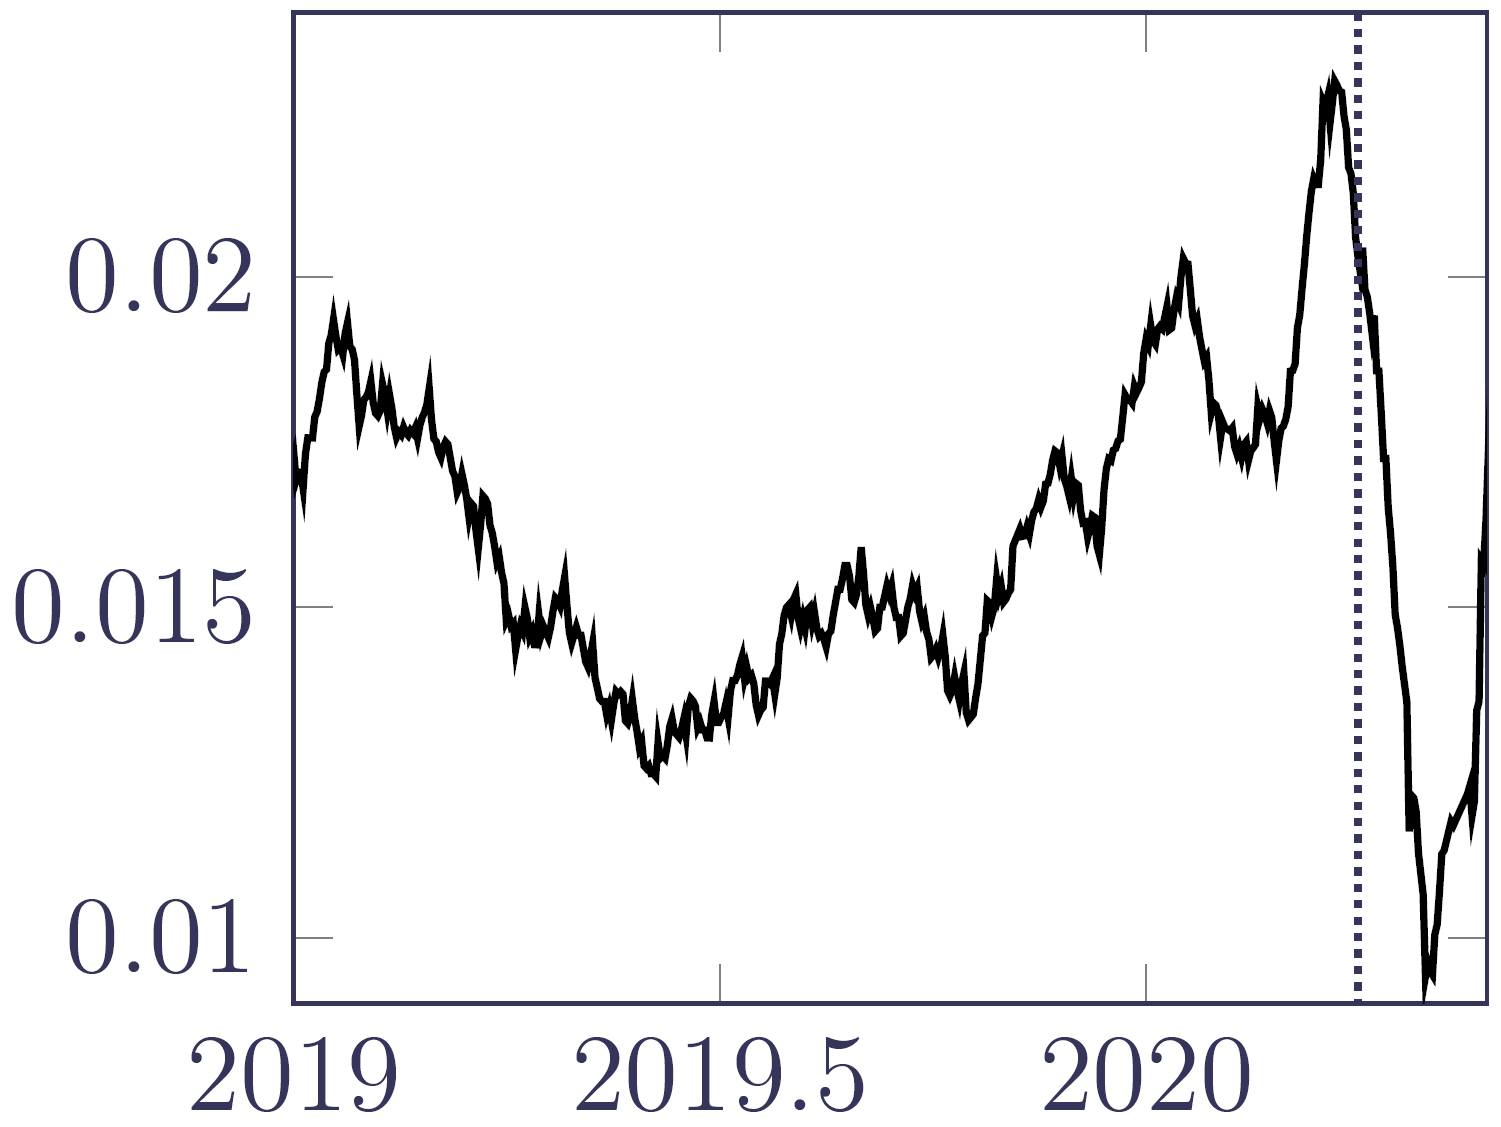
The impact of OBNR in Figure 2 is so severe that the insurer has little idea of what recent mortality levels actually were, and what deaths are likely to be reported. However, by calibrating a survival model as per equation (1) we can obtain an estimate of the OBNR function, \(\rho(u_1-y-t)\). We can then obtain a simple nowcast by dividing the semi-parametric estimator, \(\hat\mu_{y+t}\) by the OBNR function, as shown in Figure 3. The contrast with Figure 2 is dramatic, suggesting that a large number of death notifications are on their way.
Figure 3. \(\displaystyle\frac{\hat\mu_{y+t}}{\rho(u_1-y-t)}\) using a data extract from June 2020. Source: Richards (2021, Figure 13b).
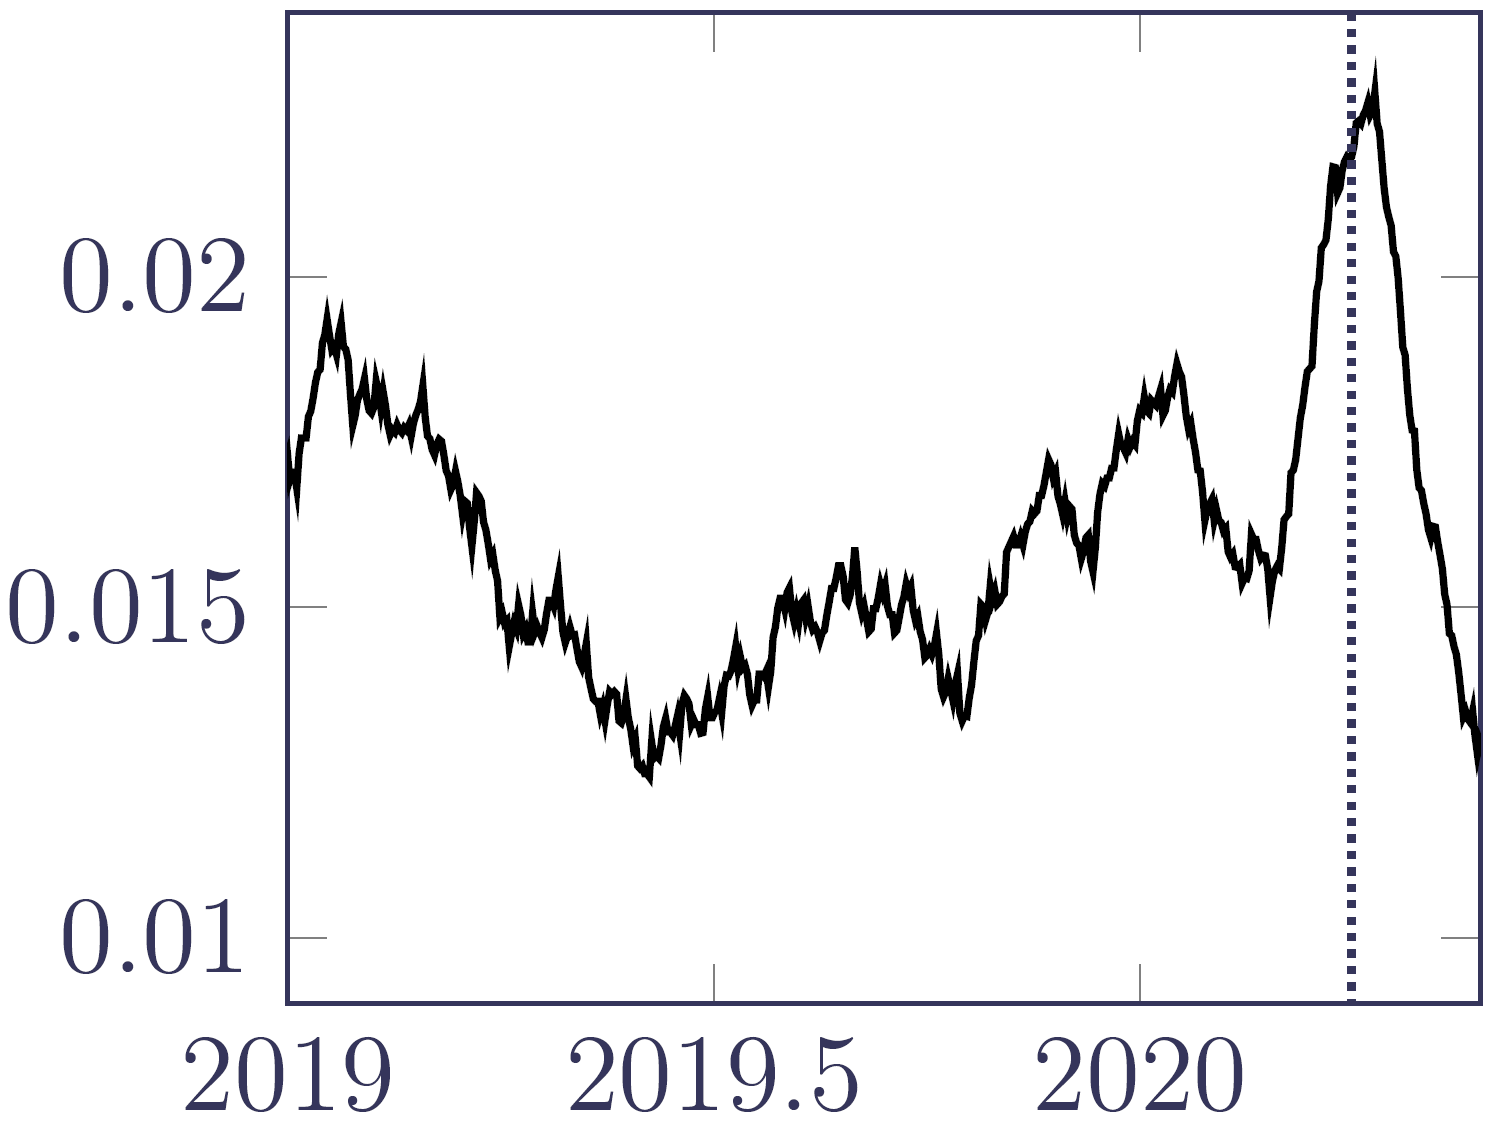
How effective was the nowcast in Figure 3? We can back-test the nowcast of June 2020 by comparing it with the value of \(\hat\mu_{y+t}\) calculated using a later extract in September 2020, as shown in Figure 4. Although Figure 4 is obviously still subject to some reporting delays, a comparison with Figure 3 shows that the nowcast performed fairly well. The insurer would thus have been forewarned that there were a significant number of deaths about to be notified.
Figure 4. \(\hat\mu_{y+t}\) using a data extract from September 2020, showing the much-reduced impact of reporting delays on the right as \(y+t\) approaches June 2020. The dotted vertical line marks 1st April 2020. Source: Richards (2021, Figure 13c).
References:
Bańbura, M., Giannone, D., Modugno, M. and Reichlin, L. (2013) Now-Casting and the Real-Time Data Flow, in Handbook of Economic Forecasting, Elsevier, edited by Graham Elliott and Allan Timmermann, ISSN 1574-0706
Lawless, J. F. (1994) Adjustments for reporting delays and the prediction of occurred but not reported events, Canadian Journal of Statistics, 22(1):15–31, 1994, doi 10.2307/3315826.n1.
Richards, S. J. (2021) Mortality shocks and reporting delays in portfolio data, Longevitas working paper.
Add new comment