Fifty years of mortality improvements
In an earlier post we looked at the development of the distribution of age at death over time. We saw how the peak adult age at death had continuously moved towards an ever-higher age.
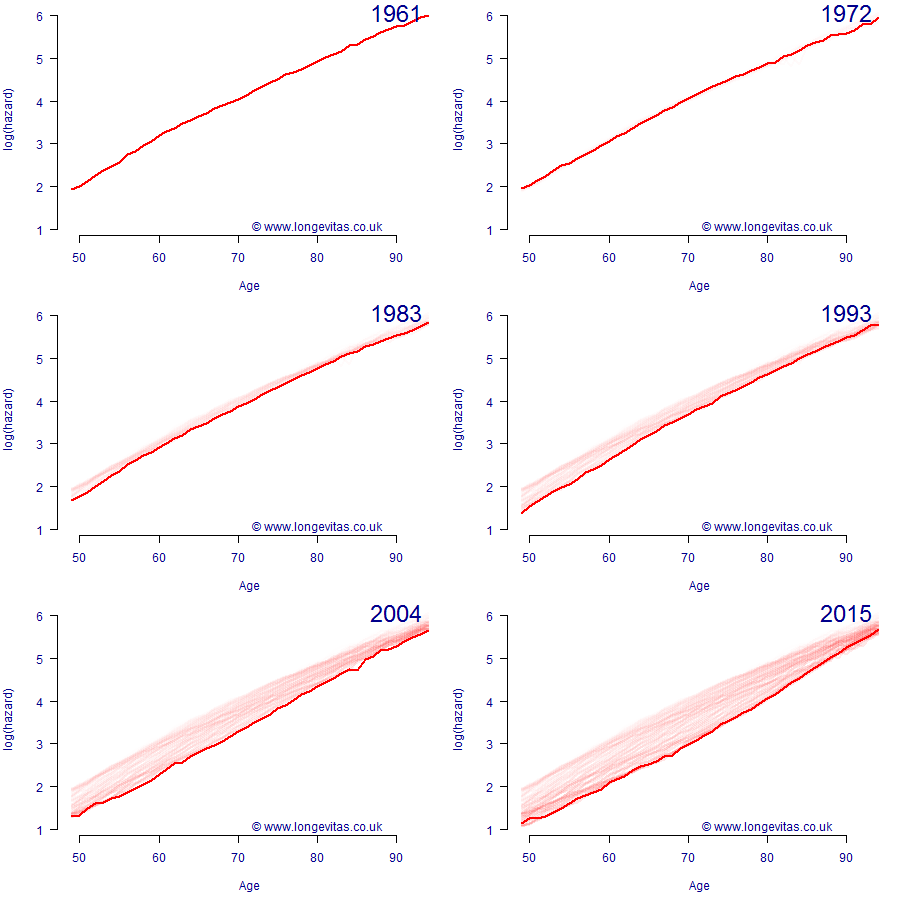
Actuaries, of course, are very interested in the development of mortality rates over time. Animation 1 shows the development of the crude observed force of mortality for males of retirement age in the UK since 1961. It shows that mortality rates have fallen at all ages, but much more so at ages below 80 than above.
Animation 1. Male mortality rates by age in England and Wales since 1961 (log scale). Click on the chart to restart the animation. Note that the mortality rates were calculated using post-2001 population estimates that had been revised after the 2011 census.

A current topic of discussion is the relatively heavy mortality of recent years, part of which can be ascribed to heavy excess winter mortality. However, Animation 1 puts this into historical perspective, where the long-term trend to lower mortality rates is very clear.
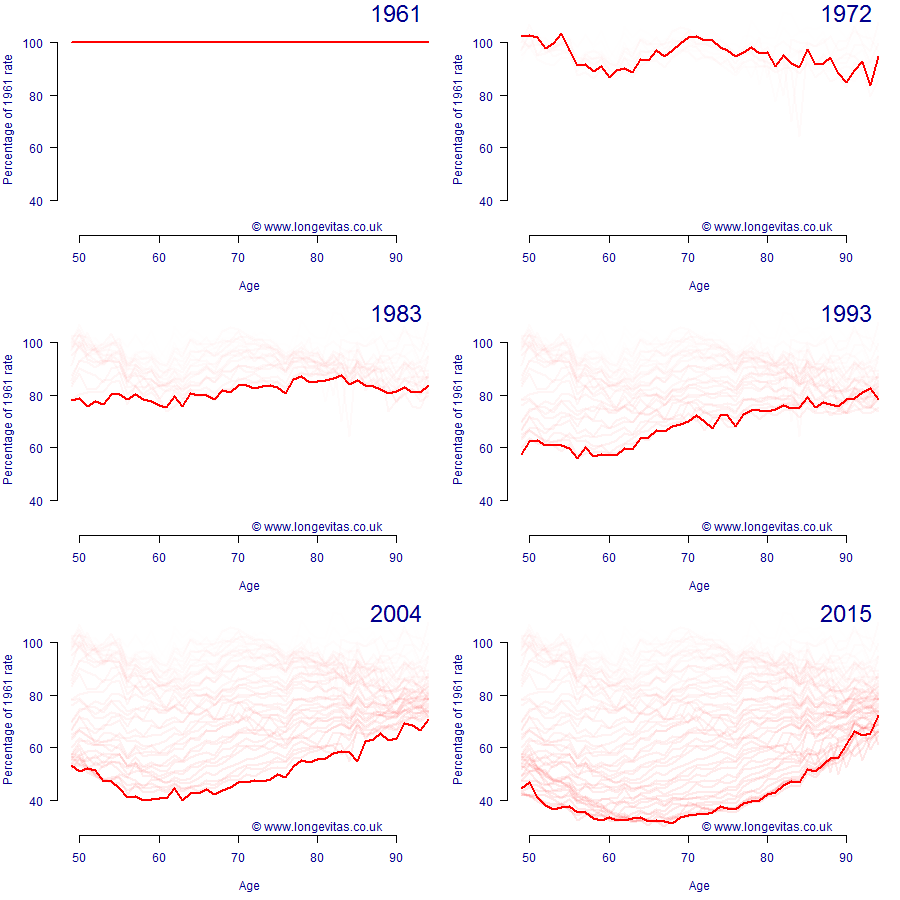
Another way of looking at this is to express each year's mortality rate as a ratio of the equivalent rate in 1961. This is shown in Animation 2, where we can see that mortality rates have fallen by over 60% between 60 and 70, an age range with an outsized impact on annuity profitability for insurers.
Animation 2. Ratio of male mortality rates in UK by age and calendar year to equivalent rates in 1961. Click on the image to restart the animation.

Animation 2 also reveals something not immediately obvious in Animation 1 — even after allowing for the recent increase in mortality, rates at around age 90 have still fallen overall by 40% since 1961.
Previous posts
Universal prescription
Frailty models
A population consists of individuals, each with their own genetics, lifestyle, and yes, their very own force of mortality. National mortality data, such as held by the Office for National Statistics (ONS), are observed only at the population level and the variation in the force of mortality across individuals of the same age is forever hidden. The purpose of this blog is to show how we can attempt to model this hidden heterogeneity.


Add new comment