Mortality down under
Different countries have different mortality characteristics, and this is true even where countries have similar levels of wealth and development. However, different countries also have shared mortality characteristics, and one of these is seasonal variation. Past blogs on this topic have focused on the UK, but I thought it would be time to consider a country new to Information Matrix: Australia.
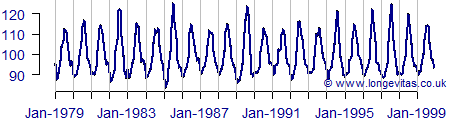
Figure 1 shows the long-established phenomenon of peak mortality in winter, and low mortality in summer. The twist is that winter in the Southern Hemisphere is around six months after (or before) the winter in the Northern Hemisphere, so peak winter mortality occurs at a different point in the calendar.
Figure 1. Percentage of average daily number of deaths in Australia, all causes, 1979–1999. Source: de Looper (2002).
Another thing that our Australian cousins have in common with us is that the seasonality in mortality varies a lot by cause of death. Figure 2 shows that cancer mortality has no meaningful seasonal pattern, whereas mortality due to circulatory and respiratory causes have very strong seasonal patterns. Indeed, mortality due to respiratory causes (pneumonia and influenza) can peak in winter at five times the rate in the summer trough. In addition to their seasonal variation, we note in passing that influenza and circulatory disease are linked in other ways, thus complicating attempts to project mortality by cause of death.
Figure 2. Percentage of average daily number of deaths in Australia, selected causes of death, 1979–1999. Source: de Looper (2002).
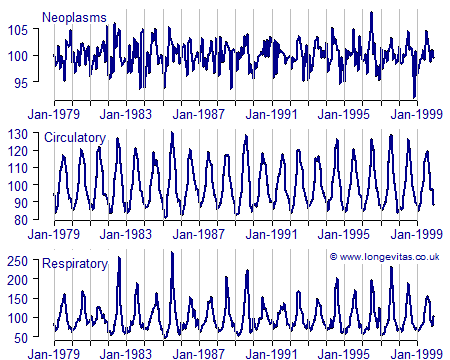
Figure 2 also helps explain why seasonal variation in mortality increases with age: causes of death like circulatory disease increase with age, so the seasonality of such causes will find greater expression at advanced ages. But how do we know that it is the cause of death that is seasonal, rather than age itself driving seasonal effects? After all, if the elderly dominate deaths due to circulatory disease, how do we know that the pattern in the middle of Figure 2 isn't driven by age? The answer can be found in the top panel in Figure 2: mortality due to cancer also increases with age, and the elderly dominate deaths due to cancer, yet there is no obvious seasonal aspect to mortality due to neoplasms. Thus, it is the causes of death that are seasonal, and so the increasing share of those causes by age will drive increasing seasonal variation.
References:
de Looper, M. (2002) Seasonality of death, Australian Institute of Health and Welfare, Picton Press.
Add new comment