Seasonal mortality and age

In two previous blogs (here and here) I looked at excess winter mortality.  A first glance at the charts shows that the elderly dominate the death counts.  However, the elderly also happen to provide the bulk of deaths at any time of year, so how can we be sure that they are more vulnerable to seasonal variation?

One approach is to look at the numbers of deaths in each age group over a period of a few years.  If we group the deaths by month of occurrence we will expose any seasonal pattern, assuming the population exposures are roughly constant.  If we then standardise these monthly counts by dividing by the count in a reference month (June, say) then we will have percentage fluctuations by month for each age group.  If the lines overlap with random variation, the mortality of each age group will be roughly equally affected by season.  However, if we get a series of steeper (or shallower) curves by age, then we will have evidence that seasonal variation increases (or decreases) with age.  Figure 1 shows the June-standardised percentages for four broad age groups in England & Wales.

Figure 1. Deaths in England and Wales by month of occurrence and age group as percentage of June count, 2015–2017. Source: own calculations using ONS data.

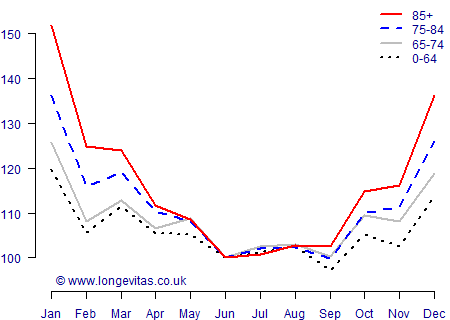
Figure 1 confirms what we expect: there are seasonal patterns in all age groups, with deaths tending to peak in January.  However, the curves clearly become steadily steeper as age increases.  Peak winter mortality is up to 20% higher than summer mortality for those aged 0–64, but up to 50% higher for those aged 85 and over.  One consequence of an ageing society will therefore be greater fluctuations in seasonal mortality.

Written by: Stephen Richards
Publication Date:
Last Updated:

Seasonal patterns in Longevitas

Longevitas supports two methods of modelling seasonal patterns:

  1. The CalendarPeriod variable, and
  2. The SeasonalEffect variable.

Longevitas users can fit models with a variety of period effects using the CalendarPeriod variable. Simply go to the Configuration section and enable this in the Modelling tab. There you will also have the option to select the frequency of effects, as well as their alignment during the year. The CalendarPeriod is a categorical variable, i.e. the effect is assumed to be constant within the period.

The SeasonalEffect variable is a feature of the Hermite family of models. It is a continuous variable, and so is a more parsimonious option when modelling post-retirement mortality differentials.

Previous posts

The Hermite model of mortality

In Richards (2012) I compared seventeen different parametric models for modelling the mortality of a portfolio of UK annuitants. The best-fitting model, i.e. the one with the lowest AIC, was the Makeham-Beard model:

\[\mu_x = \frac{e^\epsilon+e^{\alpha+\beta x}}{1+e^{\alpha+\rho+\beta x}}\qquad(1)\]

Tags: Filter information matrix by tag: Hermite splines, Filter information matrix by tag: extrapolation

The Poisson assumption under the microscope

If you read almost any paper on modelling mortality you will find the assumption that the number of deaths follows the Poisson distribution.

Add new comment

Restricted HTML

  • Allowed HTML tags: <a href hreflang> <em> <strong> <cite> <blockquote cite> <code> <ul type> <ol start type> <li> <dl> <dt> <dd> <h2 id> <h3 id> <h4 id> <h5 id> <h6 id>
  • Lines and paragraphs break automatically.
  • Web page addresses and email addresses turn into links automatically.