Visualising data-quality in time
In a recent blog I defined the Nelson-Aalen estimate with respect to calendar time, rather than with respect to age as is usual. I showed how a simple difference of this estimate could be used to reveal seasonal patterns in mortality, and also how it could identify shocks like covid-19. However, this time-based non-parametric estimator also turns out to be handy for detecting data-quality issues.
To recap, the Nelson-Aalen estimate of the integrated hazard from time \(y\) to \(y+t\) is denoted \(\hat\Lambda_{y,t}\); it is defined as follows:
\[\hat\Lambda_{y,t} = \sum_{t_t\le t}\frac{d_{y+t_i}}{l_{y+t_i^-}}\qquad (1)\]
for a set \(\{y+t_i\}\) of distinct times (dates) of death with \(d_{y+t_i}\) denoting the number of deaths at time \(y+t_i\) and \(l_{y+t_i^-}\) denoting the number of lives under observation immediately before time \(y+t_i\). We then calculate an estimate of the aggregate mortality hazard, \(\hat\mu_{y+t}\), as follows:
\[\hat\mu_{y+t}= \frac{1}{c}\left(\hat\Lambda_{y,t+c/2}-\hat\Lambda_{y,t-c/2}\right)\qquad (2)\]
for some value of the bandwidth parameter \(c>0\) years. Figure 1 shows the result of applying equation (2) to a portfolio of annuitants in France.
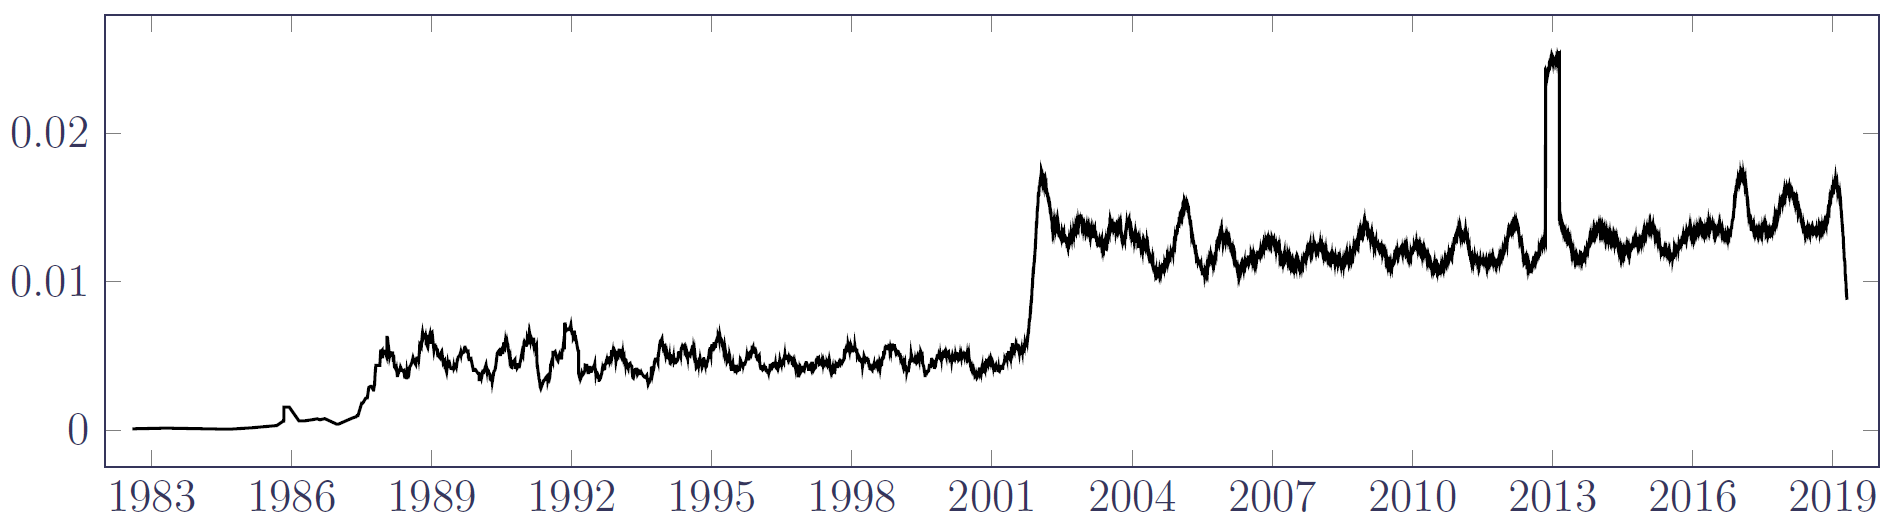
Besides the usual seasonal variation, Figure 1 shows at a glance that the data set has three distinct phases:
- Some sparse deaths data for a period up to around 1988,
- A period of stable experience data 1988–2001, and
- A period post-2002 with a far higher aggregate mortality rate.
Clearly the experience data prior to 1988 cannot be used for mortality analysis. But what caused the jump between the second and third phases? We could be dealing with a portfolio that was merged with another portfolio with a substantially higher age, hence the near-tripling of the mortality rate. However, in this case the policy counts (not shown) demonstrate steady growth and no discontinuity, which means that the 1988–2001 phase of experience data must be systematically missing death records, regardless of its apparent stability. The estimator in equation (2) reveals the usable part of the exposure period to be post-2002 for the portfolio. Of course, this could have also been found by trial and error from fitting models and examining the residuals, but inspection of Figure 1 saves time.
The spike in mortality rate at the start of 2013 in Figure 1 is also of interest. This was traced to 670 “deaths” on 1st January 2013, which was clearly not the actual date of death for these annuitants. As before, this sort of data issue could also be caught by the tabulation of the most commonly occurring field values [Macdonald et al., 2018, Section 2.7]. However, the estimator in equation (2) provides a clear visual clue that something is amiss with the data at the start of 2013.
Long-standing readers of this blog might recall that this isn't the first non-parametric estimator useful for data-quality checks. In a much earlier blog I showed how the Kaplan-Meier estimator unmasks subtle data corruptions that cannot be detected from simple comparisons against a standard table. Non-parametric statistics have a wider application to actuarial work than first meets the eye!
References:
Macdonald, A. S., Richards, S. J. and Currie, I. D. (2018) Modelling Mortality with Actuarial Applications, Cambridge University Press, ISBN 978-1-107-04541-5.
Richards, S. J. (2020) A non-parametric estimator for mortality shocks, working paper, Longevitas Ltd.
Previous posts
Visualising covid-19 in experience data
As 2020 edges to a close, life-office actuaries need to set mortality bases for year-end valuations. An obvious question is what impact the covid-19 pandemic has had on the mortality experience of their portfolio? One problem is that traditional actuarial analysis was often done on the basis of annual rates, whereas the initial covid-19 shock was delivered over a period of a couple of months in early 2020 in Europe.
Add new comment