Spotting hidden data-quality issues
The growing market for longevity risk-transfer means that takers of the risk are keenly interested in the mortality characteristics of the portfolio concerned. The first thing requested by the risk-taker is therefore detailed data on the portfolio's recent mortality experience. This is ideally data extracted on a policy-by-policy basis. Once received, the careful analyst checks that the data are sound. Failure to spot data problems at the start will at best waste time, and at worst lead to concluding a deal on bad terms. There is therefore tremendous value in simple checks of data quality.
We saw in an earlier post how survival models can reveal data problems. However, these issues can sometimes be spotted even more easily using the estimator proposed by Kaplan & Meier (1958). As an example of this, consider Figures 1–4, which plot the Kaplan-Meier functions for males and females in a number of different European portfolios we have analysed in recent years. Figures 1–3 show that females show a clearly higher survival probability at all ages, irrespective of whether the portfolio is Dutch, French or German. This emphasizes the wide applicability of the Kaplan-Meier estimator.
However, Figure 4 suggests that there is something wrong with the data in the UK annuity portfolio. This is not because there is something special about either the UK or annuities, because Kaplan-Meier functions for other UK annuity portfolios look just like the Dutch, French and German portfolios in Figures 1–3. In our experience, the sort of pattern exhibited in Figure 4 is sometimes a result of data corruptions relating to the processing of benefits for a surviving spouse.
Figure 1. Kaplan-Meier function for Dutch private-sector occupational pension scheme. Source: Own calculations.
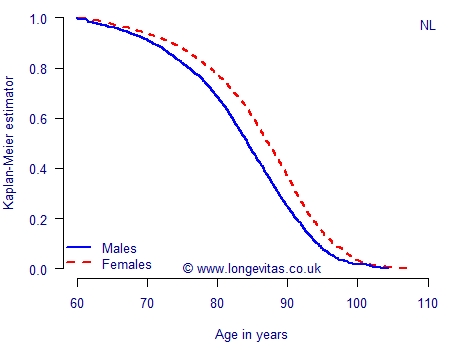
Figure 2. Kaplan-Meier function for French public-sector top-up pension scheme. Source: Own calculations.
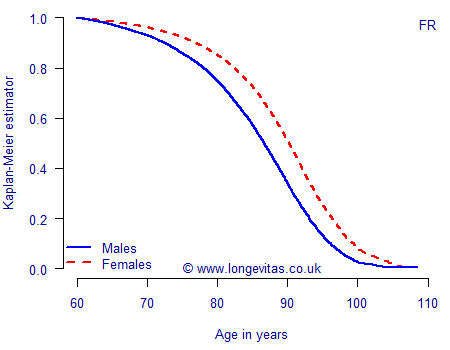
Figure 3. Kaplan-Meier function for German public-sector top-up pension scheme. Source: Richards, Kaufhold and Rosenbusch (2013).
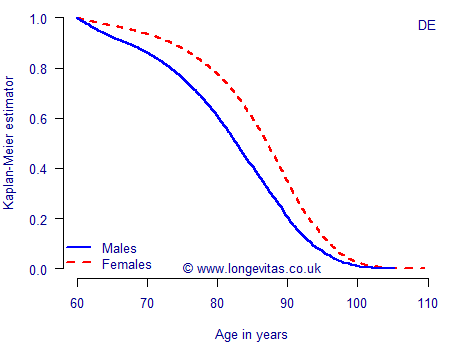
Figure 4. Kaplan-Meier function for UK annuity portfolio. Source: Own calculations.
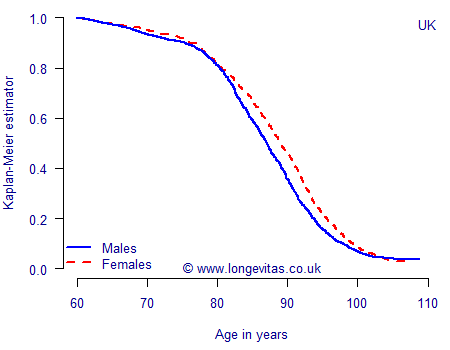
One particularly important aspect of Figure 4 is that this kind of data problem cannot be detected from a simple A/E comparison against a standard table. To spot this kind of issue you must either plot the Kaplan-Meier function or else fit a statistical model and observe the suspicious parameter values for gender differentials. In practical day-to-day work, however, we find that the graphical nature of the Kaplan-Meier check means it is immediately understood by non-statisticians.
UPDATE on 2024-11-19: This later blog gives some R code to calculate the Kaplan-Meier estimate for left-truncated ages. It has an example data file for a UK pension scheme.
References:
Kaplan, E. L. and Meier, P. (1958) Nonparametric estimation from incomplete observations, Journal of the American Statistical Association 53, 457–481.
Richards, S. J., Kaufhold, K. and Rosenbusch, S. (2013) Creating portfolio-specific mortality tables: a case study, European Actuarial Journal, 3, 295–319 (2013). doi:10.1007/s13385-013-0076-6
Add new comment