What — and when — is a 1:200 event?
The concept of a "one in two hundred" (1:200) event over a one-year time horizon is well established as a reserving standard for insurance in several territories: the ICA in the United Kingdom, the SST in Switzerland and the forthcoming Solvency II standard for the entire European Union. The basic idea is simple: insurers must be capitalised to withstand 99.5% of events which could arise over the coming year. Other territories use concepts like conditional tail expectations.
There is room for debate as to what constitutes a 1:200 event, however. For example, Figure 1 shows the elevated mortality caused by the 1918 influenza pandemic, which for many people would be a starting point for calibrating a modern stress scenario for mortality risk.
Figure 1. Ratio of mortality rates in 1918 to mortality rates in 1917. Source: own calculations using Swedish population data (males only) from the Human Mortality Database.
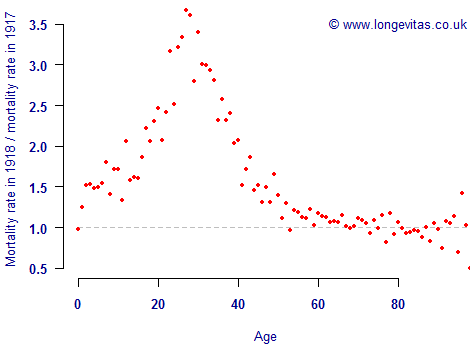
Analysts will not all agree whether the 1918 pandemic is a candidate 1:200 event, but they can at least agree when it took place and what precisely happened in terms of mortality rates. Unfortunately, actuaries calibrating a stress for longevity risk do not even have this luxury:
"Whereas a catastrophe can occur in an instant, longevity risk takes decades to unfold."
The Economist, The ferment of finance,
February 25th 2012.
This is illustrated by contrasting Figure 1 with Figure 2, which shows the mortality rates for males aged 70 in Sweden. Visually, we have mortality rates falling steadily for five decades, then we have two decades of stagnation, then finally three decades of plummeting mortality (followed by a fourth decade of plummeting, although this is not shown).
Figure 2. \(\hat m_{70}\) for males in Sweden. Source: own calculations using population data from the Human Mortality Database.
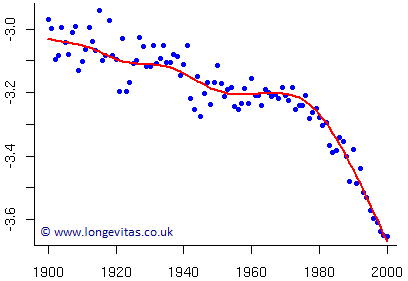
Figure 2 looks like there were three phases to the mortality of seventy-year-olds over the course of the 20th century. Is this enough to calibrate a longevity stress? We could go back further in time, but how relevant are 19th-century mortality rates to pension liabilities in the 21st century?
While analysts could agree that the strongest improvements occurred in the latter decades, they are unlikely to agree on the precise start of the sharp downward trend: was it 1970 or 1975? Even this question is made easier with the benefit of hindsight — assuming we were to agree that the new trend started in 1975, say, when would an actuary have first noticed that there was a new trend: 1980? 1985? This is to say nothing of the delays in receiving population data.
The fact that longevity risk unfolds over many years makes it harder to calibrate a 1:200 shock than is the case for many other risks. It is therefore not surprising that there are different views on treating longevity under Solvency II, and thus little consensus on how much capital an insurer should hold in respect of longevity trend risk. Faced with all these difficulties, one cannot help wonder if looking for a candidate 1:200 longevity event in the past is the wrong approach.
An alternative solution is to use stochastic models in a value-at-risk framework to determine capital requirements, as done in Richards, Currie & Ritchie (2014). Such approaches have important advantages over the selection of a candidate historical event, including the use of the most recent (and relevant) data and not having to decide the probability of an event after it has been observed. While extreme longevity scenarios have their place in the risk-management toolbox, less-subjective methodologies are required to back them up.
References:
Richards, S. J., Currie, I. D. and Ritchie, G. P. (2014) A value-at-risk framework for longevity trend risk, British Actuarial Journal, 19(1), 116–167.
Value-at-risk in the Projections Toolkit
The value-at-risk for longevity trend risk can be calculated by using the ![]() facility. The user can specify the ages and interest rate (or yield curve) for calculations of life expectancies and annuity factors. The resulting output provides an estimate of the one-year 99.5% capital requirements, either on a value-at-risk basis or a conditional tail expectation (CTE).
facility. The user can specify the ages and interest rate (or yield curve) for calculations of life expectancies and annuity factors. The resulting output provides an estimate of the one-year 99.5% capital requirements, either on a value-at-risk basis or a conditional tail expectation (CTE).
Add new comment