Real-time management information
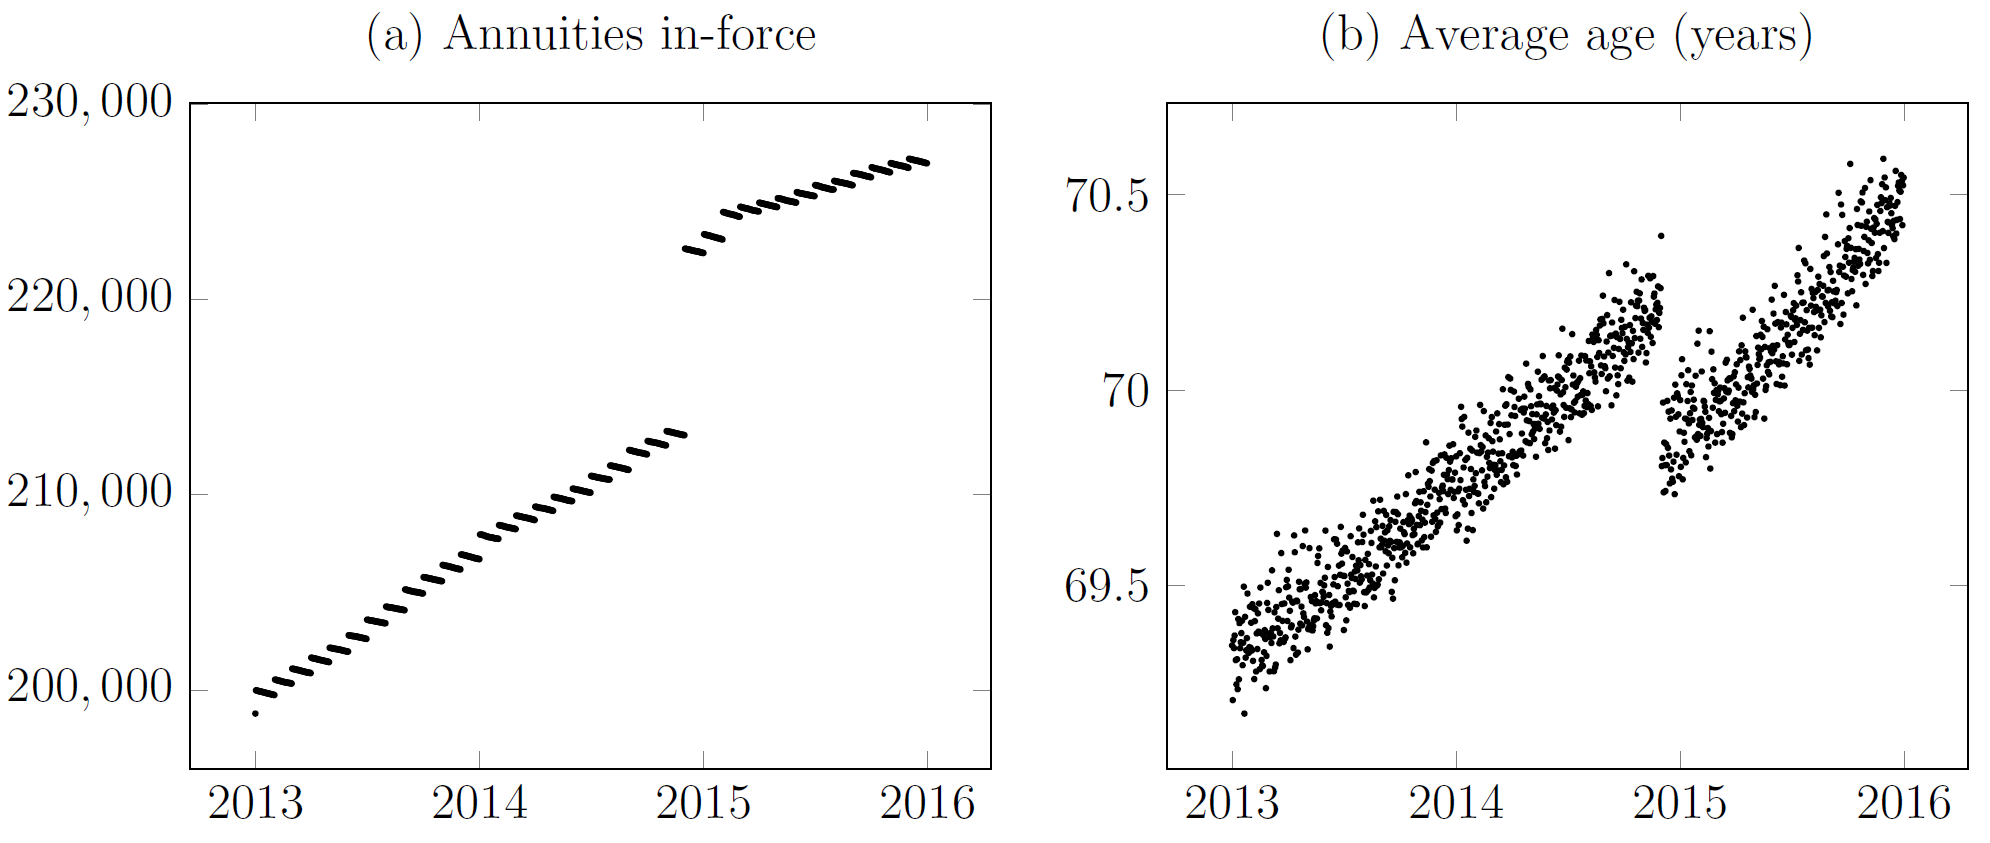
The sooner you know about a problem, the sooner you can do something about it. I have written before about real-time updates to mortality estimates during shocks. However, real-time methods also have application to everyday management questions. Consider Figure 1(a), which shows a surge in new annuities in December 2014. The volume of new annuities written in that month was large enough to shift the average age of the in-force annuities, as shown in Figure 1(b).
Figure 1. Impact of new annuities set up by French insurer. Source: Richards and Macdonald (2024).
Of course, we expect new business to have a lower average age than in-force business. A natural management question is whether this "surge" business is different from other new annuities? Assume that in mid-2015 we want to compare the new annuities set up in December 2015 and the new annuities set up in the six months before and after. Table 1 suggests that there aren't any obvious big differences between these two tranches.
Table 1. Comparison of tranches of new annuities.
| Metric | December 2014 new annuities | Other recent new annuities |
|---|---|---|
| New annuities | 9,572 | 9,033 |
| Average age at outset | 60.8 years | 61.3 years |
| Proportion female | 57.3% | 56.4% |
| Average annuity | €2,010 | €1,757 |
Of course, what really counts is the actual mortality experience of the annuitants. In particular, it is the mortality experience in the earliest few years that drives profitability (or not). However, if the insurer relies on a \(q_x\) analysis based on annual mortality rates, it has two problems. First, it will have to wait until after December 2015 to assess the mortality of the December 2014 tranche, and probably even later than this to allow for delays in death reporting. Secondly, the comparison tranche is itself spread over time, with the more recent new annuities only having a few months of exposures. How can the insurer get a timely picture of what is going on?
As it happens, non-parametric methods can help here; they are simple to calculate and can be very revealing. Consider \(\hat\Lambda(t)\), the Nelson-Aalen estimator of the cumulative risk or cumulative hazard:
\[\hat\Lambda(t)=\sum_{t_i\leq t}\frac{d_{t_i}}{l_{t_i^-}},\qquad(1)\]
where \(\{t_i\}\) is the set of distinct durations at death since annuity outset, \(l_{t_i^-}\) is the number of annuities in-force at duration \(t_i\) and \(d_{t_i}\) is the number of those annuities ceasing due to death at that duration. Equation (1) is an example of a non-parametric estimator; another is the Kaplan-Meier estimator, which also has application to annuity work.
Equation (1) can be calculated separately for (i) the December 2014 new annuities, and (ii) the new annuities immediately before and after. Crucially, equation (1) can be updated continuously to provide emerging management information, as shown in Figure 2.
Figure 2. Cumulative hazard, \(\hat\Lambda(t)\), for new annuities written by French insurer. Source: Richards and Macdonald (2024).
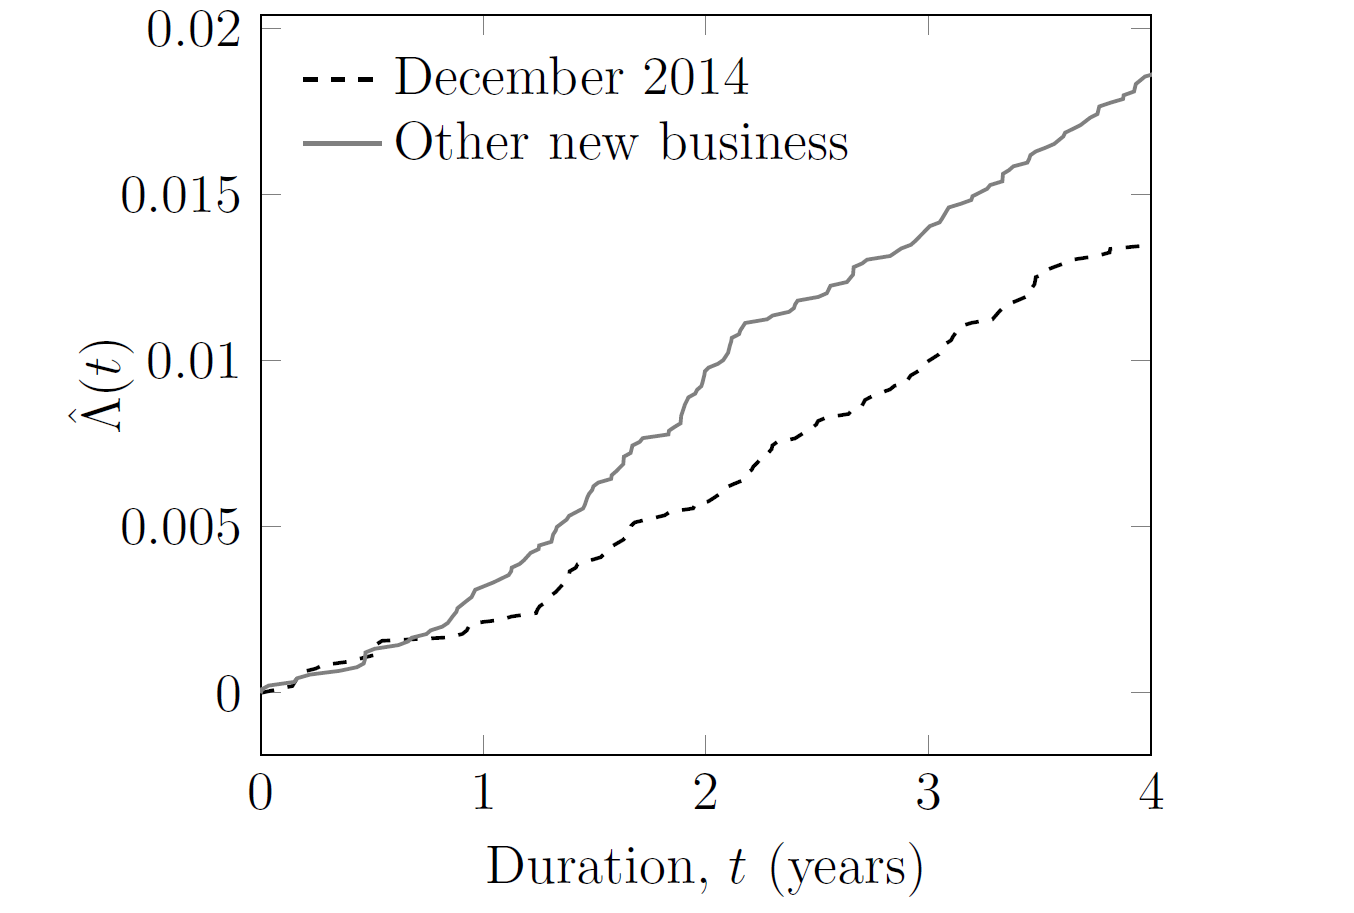
Despite the similarities in Table 1, Figure 2 shows that the December 2014 new annuities have lower mortality levels than the new annuities set up before and after. Using equation (1) this became apparent well before the second anniversary of the surge. This result lies in stark contrast with the traditional actuarial focus on the annual rate of mortality, \(q_x\), which requires insurers to wait until a complete year has passed before it can be calculated. A \(q_x\) analysis would have detected no difference after one year, and would have only been able to detect the issue well into the third year. For the most timely management information, you can't beat continuous-time methods.
References:
Richards, S. J. and Macdonald, A. S. (2024) On Contemporary Mortality Models for Actuarial Use I: Practice, British Actuarial Journal (to appear).
Add new comment