VaR-iation by age
During the public discussions of our paper on value-at-risk for longevity trend risk, one commentator asked for a fuller presentation of VaR capital requirements by age. In the paper, as with our introductory overview, we used age 70 as a representative average age of an annuity portfolio. However, annuity portfolios contain lives spanning a wide range of ages, so it is useful to examine how capital requirement might vary. Figure 1 shows the VaR longevity-trend capital requirement by age for four different models.
Figure 1. 99.5% VaR capital requirement for longevity trend risk in a level pension paid to a single-life male annuitant. Temporary annuity to age 105, discounted at 3% per annum. The capital requirements and confidence intervals are calculated using the Harrell-Davis (1982) estimate from 10,000 simulations of the method in Richards, Currie & Ritchie (2012).
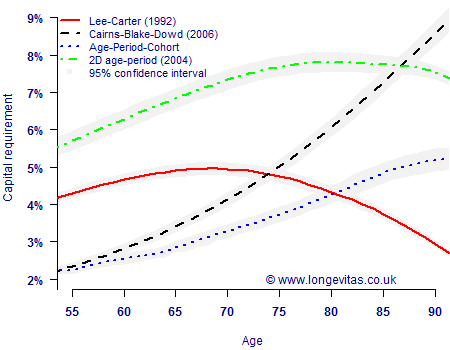
Figure 1 shows a number of important aspects to the VaR capital requirement:
- Different models give substantially different capital requirements, both in terms of shape and level. This is a manifestation of model risk, i.e. it is impossible to say which — if any — of the models is the correct one to use.
- As with other methodologies, capital requirements vary considerably by age. This emphasises the care required when using model points to calculate capital requirements.
- When using simulations to estimate a quantile like the 99.5th percentile, it is important to remember that the estimate is itself subject to uncertainty. A 95% confidence interval is shown around the capital requirements to show the uncertainty under each model.
One interesting question raised by Figure 1 is whether one needs quite as many as 10,000 simulations for this kind of work? Ordinarily we would seek to increase the number of simulations to narrow the confidence intervals, and thus improve the reliability of the tail estimate. However, in practice an analyst might be required to recommend a single percentage (and thus capital value) for use in an aggregation matrix for combining other risks. Selecting this percentage will involve a degree of judgement, as Figure 1 shows that different models produce very different levels of capital requirement. If a single percentage were being picked, the judgement would still be just as effective even if the confidence intervals were a bit wider. As I said in my opening speech to introduce the paper, if time and resources are limited, it is more important to investigate a number of alternative models with fewer simulations than it is to maximise the number of simulations under a single model. This is worth bearing in mind, because even parallel processing has its limits.
References:
Harrell, F. E. and Davis, C. E. (1982) A new distribution-free quantile estimator, Biometrika, 69, 635–640.
Richards, S. J. and Currie, I. D. and Ritchie, G. P. (2012) A value-at-risk framework for longevity trend risk, British Actuarial Journal (to appear).
Value-at-risk in the Projections Toolkit
The value-at-risk for longevity trend risk can be calculated by using the ![]() facility. The user can specify the ages and interest rate (or yield curve) for calculations of life expectancies and annuity factors. The resulting output provides an estimate of the one-year 99.5% capital requirements, either on a value-at-risk basis or a conditional tail expectation (CTE).
facility. The user can specify the ages and interest rate (or yield curve) for calculations of life expectancies and annuity factors. The resulting output provides an estimate of the one-year 99.5% capital requirements, either on a value-at-risk basis or a conditional tail expectation (CTE).
Add new comment