Modelling improvements in experience data - I
In the first of a pair of blogs we will look at how to allow for changes in mortality levels when calibrating models to experience analysis. We start with time-varying extensions of traditional parametric models proposed by actuaries, beginning of course with the Gompertz (1825) model:
\[{\rm Gompertz}: \mu_{x,y} = e^{\alpha+\beta x + \delta(y-2000)}\qquad (1)\]
where \(x\) denotes exact age and \(y\) denotes calendar time. \(\alpha\) is the intercept, i.e. (loosely) log(mortality) at age zero, while \(\beta\) is the rate of increase in log(mortality) by age. \(\delta\) is the rate of change of mortality in time (more on this later), while \(-2000\) is an offset to keep the parameters well-scaled. \(\alpha\) is only loosely the value of log(mortality) at age zero because of the term \((y-2000)\); in equation (1) \(\alpha\) is in fact the value of log(mortality) at age zero at 1st January 2000.
The Gompertz model typically fits well over the age range 60–90, but it doesn't allow for the slowing rate of increase of log(mortality) at advanced ages. If data above age 90 are present, the logistic Perks (1932) model is usually better:
\[{\rm Perks}: \mu_{x,y} = \displaystyle\frac{e^{\alpha+\beta x + \delta(y-2000)}}{1+e^{\alpha+\beta x + \delta(y-2000)}}\qquad(2)\]
If more flexibility is needed in the rate of change at advanced ages, then there is the Beard (1959) model:
\[{\rm Beard}: \mu_{x,y} = \displaystyle\frac{e^{\alpha+\beta x + \delta(y-2000)}}{1+e^{\alpha+\rho+\beta x + \delta(y-2000)}}\qquad(3)\]
where the new parameter \(\rho\) is related to the limiting rate of mortality (see the earlier blog on the cascade model of mortality). The above three models don't allow for the semi-constant mortality between ages 50 and 60, for which we also have the Makeham-Perks (1932) model:
\[{\rm Makeham-Perks}: \displaystyle\frac{e^\epsilon+e^{\alpha+\beta x + \delta(y-2000)}}{1+e^{\alpha+\beta x + \delta(y-2000)}}\qquad(4)\]
where \(e^\epsilon\) is the minimum rate of mortality. We fit these four models to experience data from a large English pension scheme and calculate the implied annual improvement rate around the mid-point of the exposure period \(100\%*\left(1-\mu_{x,2005}/\mu_{x,2004}\right)\). The results are shown in Figure 1.
Figure 1. Implied annual improvement rate per annum for equations (1)-(4) fitted to experience data for an English pension scheme (ages 60–105, 2001–2009).
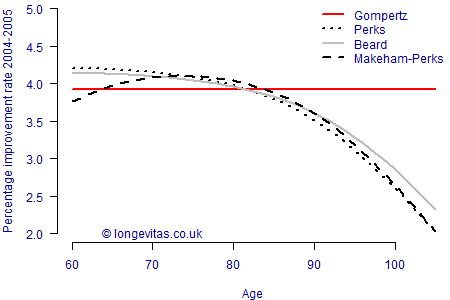
Figure 1 shows that the constant implied improvements under the Gompertz model are the least realistic. The logistic forms of the other models not only fit the data better in terms of the AIC (not shown), but also provide a more sensible (i.e. lower) rate of improvement at older ages. Perhaps the best of the four models is Makeham-Perks, which provides the greatest variation in shape of improvement rate over the age range shown.
References:
Beard, R. (1959) Note on some mathematical mortality models, in The Lifespan oif Animals, edited by G. E. W. Wolstenholme and M. O'Connor, Little, Brown, Boston, 302–311.
Gompertz, B. (1825) The nature of the function expressive of the law of human mortality, Philosophical Transactions of the Royal Society, 115, 513–585.
Perks, W. (1932) On some experiments in the graduation of mortality statistics, Journal of the Institute of Actuaries, 63, 12–40.
Previous posts
Modelling improvements in experience data - II
In my previous blog I looked at the implied mortality improvements from time-varying traditional actuarial survival models. In this blog we consider the implied improvements under the newer Hermite-spline model I proposed in Richards (2019). This paper included an explicit attempt to model age-related mortality changes, as dis
Add new comment